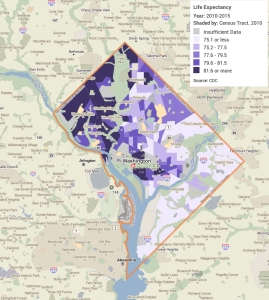
PolicyMap now provides access to new life expectancy data from the Centers for Disease Control & Prevention. This data provides standardized life expectancy data at census tract level, and allows identification of neighborhood-level differences in life expectancy as shown in this map of life expectancy in Washington, DC using CDC data on 'Life expectancy at birth, as of 2010-2015'.
Learn more about this data and PolicyMap functionality via PolicyMap's article Knowing Life Expectancy to Improve Public Health.
Himmelfarb Library provides access to PolicyMap . To learn more about PolicyMap, please ask us, review the PolicyMap YouTube Channel, or check out tutorials including:
- Maps: easily display data using different geographic parameters
- Tables: View data as a bar graph or chart to compare multiple geographies
- Reports: Run reports for predefined geographic areas or create a custom area
- 3-Layer maps: Find areas that meet up to three criteria for site selection or to locate hot spots
- Data loader: updaload your own address-level data
- Data download: download PolicyMap data for use in your research