Skip to content

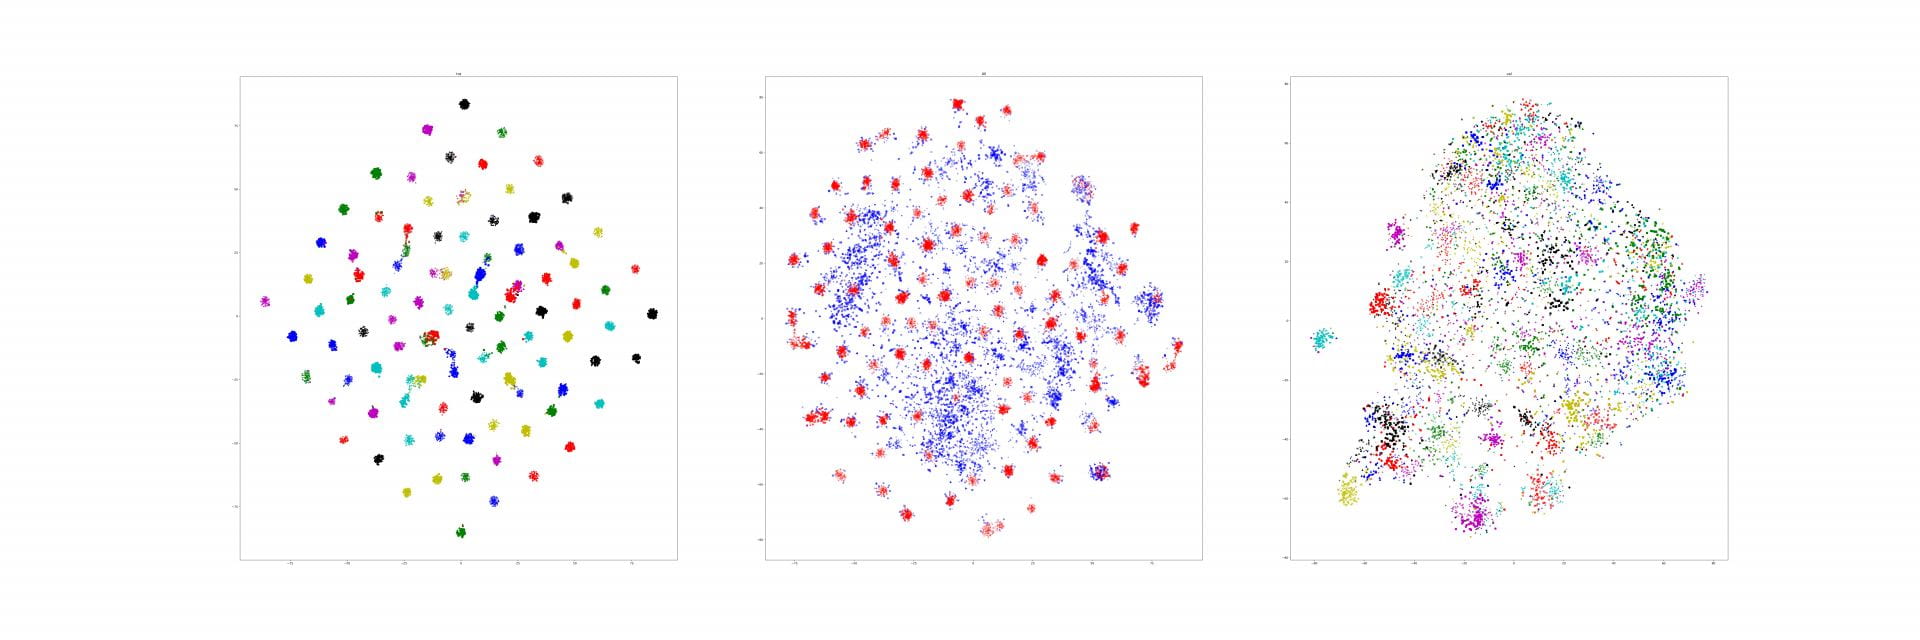
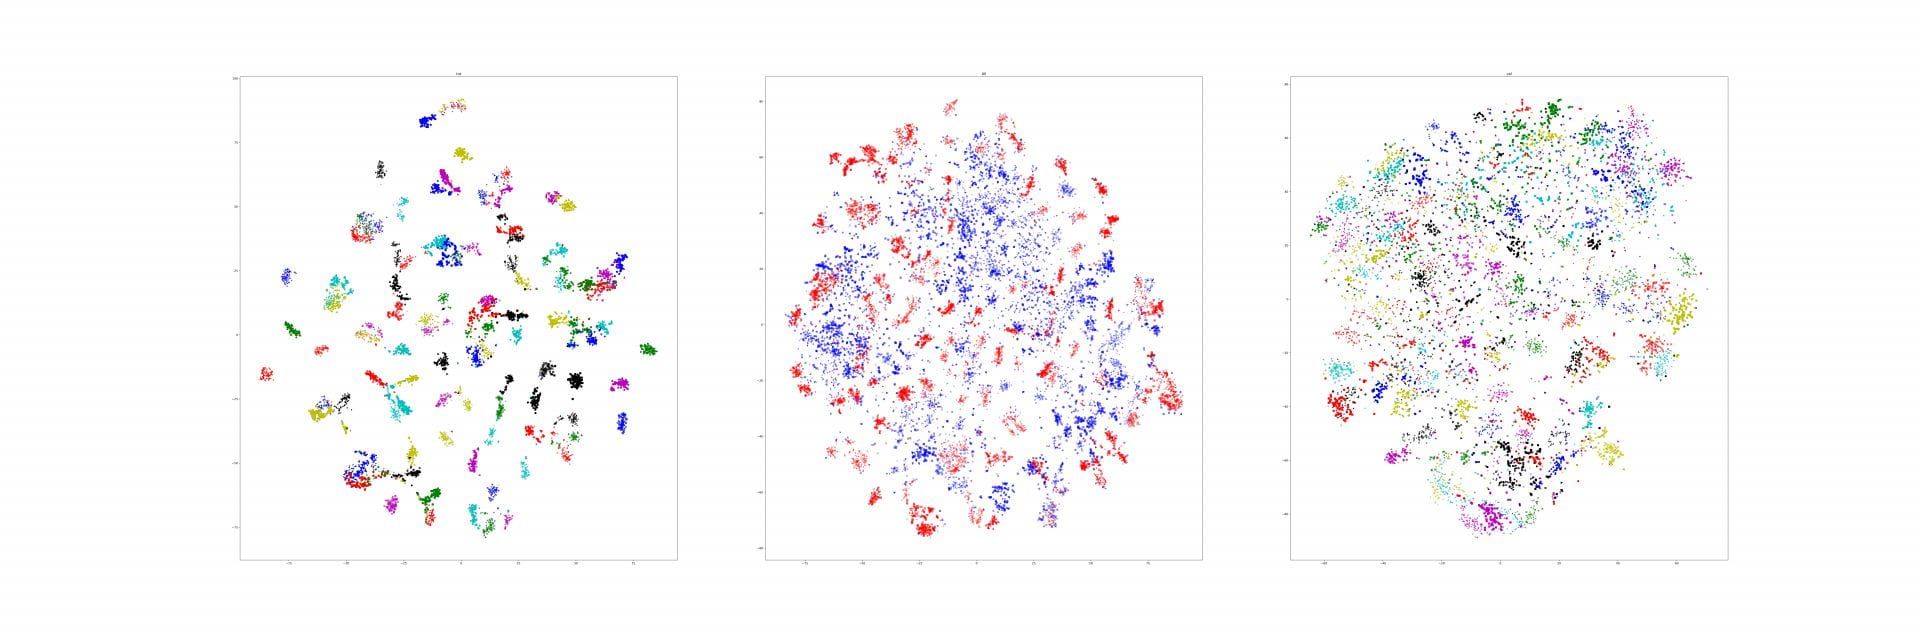
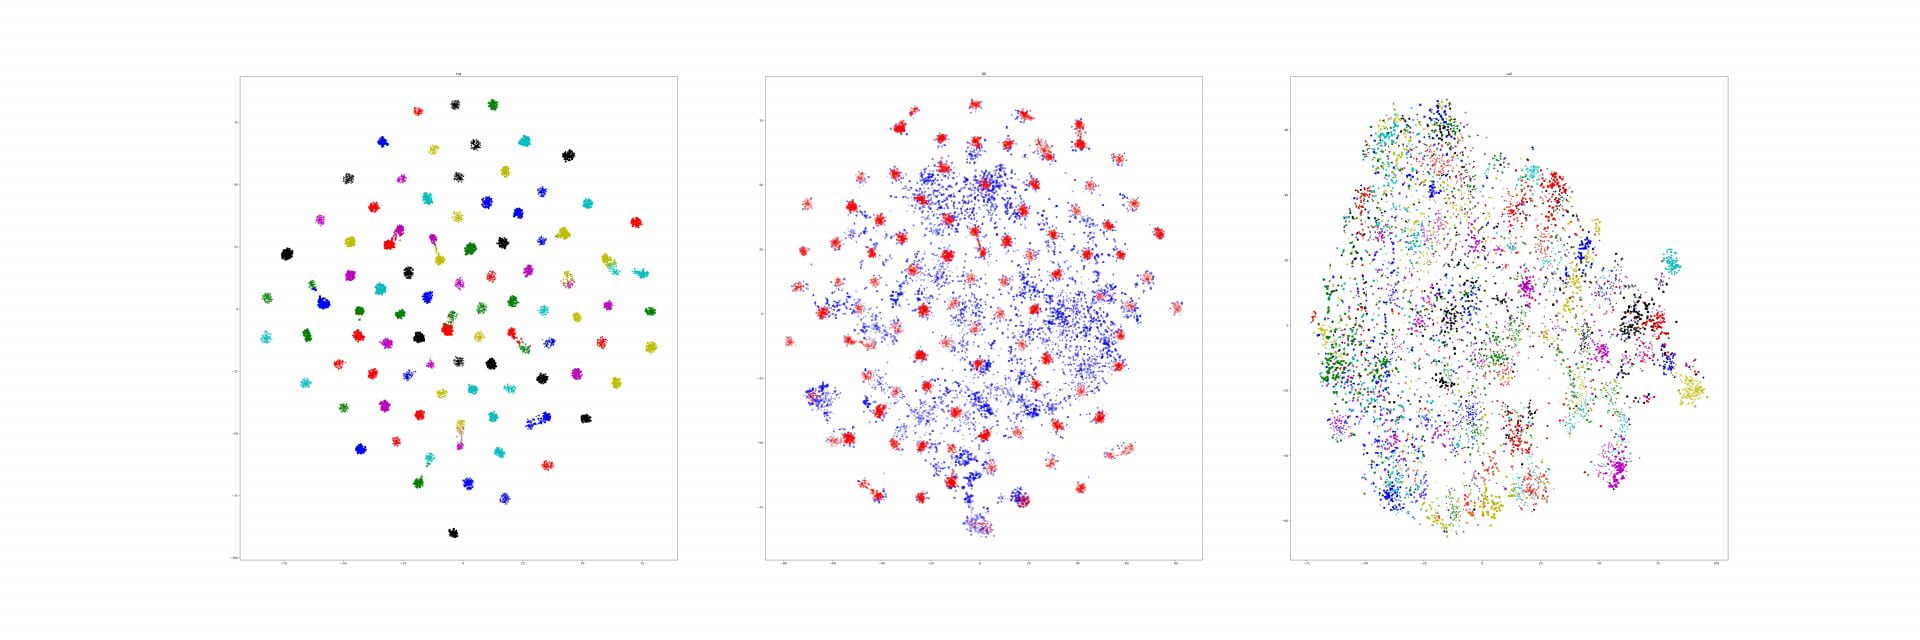
Last week, I find a problem of UMAP which is that if the high graph of a embedding representation is not connected, like NPair result on CAR training dataset, the optimizer of UMAP will keep push each cluster far away, which doesn't matter in visualization, but in TUMAP, we need to measure the loss of each map.

So, we try some different way to avoid or solve this problem.

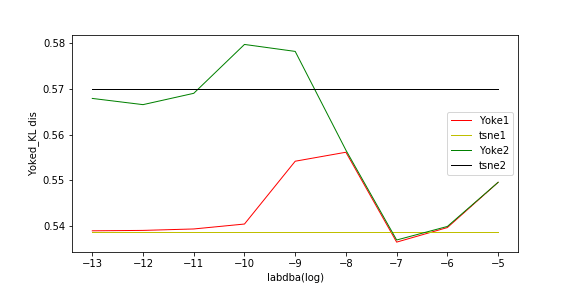
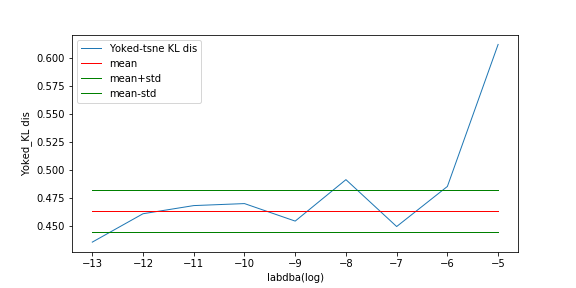
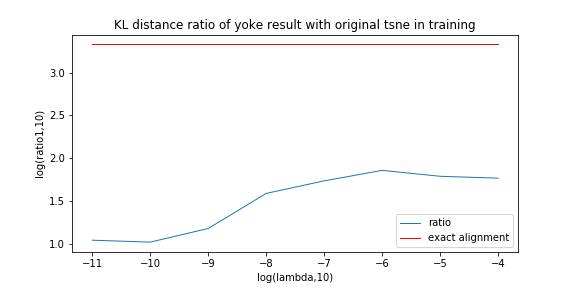
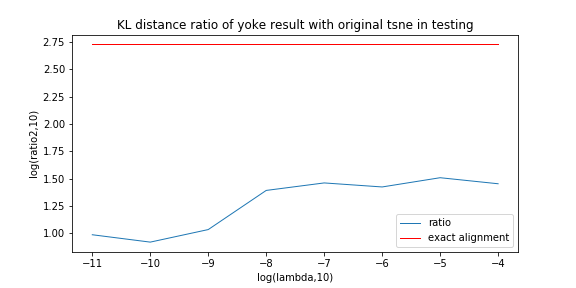
First, we compute KL distance of normal UMAP with TUMAP result instead of compare their loss.

Second, we try to optimize the repulsive gradient of edge in the high graph instead of each connection of every two points. But the result of this method gonna wired.

And, I try add a 0 vector into the high dimensional vectors, and make it equally very far from each points when constructing high-D graph. It doesn't work.

UMAP paper: https://arxiv.org/abs/1802.03426

Here are some attempt based on a python module, umap-learn

First, we try UMAP on some Gaussian dataset.

(1): We generate two different Gaussian distribution dataset (1000*64,1000*64) in different location (mean), and visualize it by a)random pick two dimension b) umap, c) tsne.

(2): We generate two different Gaussian distribution dataset (1000*64,1000*64) in different scale (std), and visualize it by a)random pick two dimension b) umap, c) tsne.

(2): We generate two different Gaussian distribution dataset (1000*64,1000*64) in different location(mean) and scale (std), and visualize it by a)random pick two dimension b) umap, c) tsne.


Then, we try to compare result of t-SNE and UMAP on embedding result of npair and epshn, on CAR dataset.

Npair on training data:

Npair val data:

EPSHN tra data:

EPSHN val data:

In order to figure out generalization ability of different embedding method, I get feature vectors of CAR dataset which is training by different loss function.

For all loss function, the dataset is split into training data (first 100 categories) and validation data (rest). and it will show the t-sne for training, testing and all data following:

1.  Lifted Structure (Batch All):  training on Resnet-18.

2. Triplet loss (Semi-Hard Negative Mining): training on Resnet-18.

3.Easy Positive Semi-Hard Negative Mining: training on Resnet-18.

4. Npair Loss : training on Resnet-18:

5. Histogram loss: training on Resnet-50:

In order to figure out how yoke tsne work and dig deep into it. In this experiment, I run two tsne from two different initialization and yoke them together by different lambda.

This experiment is running on training set of CAR196 dataset.

This result is very similar to my previous experiment which yoke different embedded data together (Npair vs Proxy).

I calculate kl distances of same image pair by pytorch and sklearn code, and compare them. Unfortunately, they are different. So I check the pytorch code, find that the Q in pytorch have a little bug (add 2 instead of 1 in the numerator of Q). After fixing, they get same result now. I don't know how this bug will affect t-sne converge. So, I just re-run experiments. So far, experiments for all data in CUB dataset is done, for training data in CAR dataset is done.

The result is as following:

All of them are based on Npair loss


CAR_training dataset:

CUB_training dataset:

CUB_testing dataset:


And, I tried to visualize kl distance for each point in a tsne map.


First of all, I haven't visualize my data so it is a no figure post.

In last few days, I was trying to find how KL distance between high embedding affect lambda selection. And I just run several of experiments.

I get three original tsne and nine yoked tsne for different lambda for following datas.

Proxy to NPAIRS, on TEST  data, for CARS

Proxy to NPAIRS, on TEST  data, for CUB

Proxy to NPAIRS, on TRAIN data, for CARS

Proxy to NPAIRS, on TRAIN data, for CUB

I have get result yet so I don't have a conclusion right now.


Second things, I modify tsne module in sklearn. Now, we can use BHt-sne on our yoked method. The time cost from 30 mins decreases to 10 mins for 8000 points.

In last week we try to visualize the Npair loss training process by yoked t-sne. In this experiment, we use CUB dataset as our training dataset, and one hundred categories for training, rest of them for testing.

And, we train our Res-50 by Npair loss on those training data for 20 epoch, recording the embedding result for all training data in the end of each training epoch, and use yoked t-sne to align them.

This result is as following:

In order to ensure the yoked tsne didn't change the distribution too much, I record the KL distance of tsne plane with embedding plane for original tsne and yoked tsne. It seems that with training processing, the KL distance decrease on both original and yoked tsne. I think the reason is with limited perplexity, a structural distribution is easier to describe on tsne plane. And, the ratio between such KL distance between original and yoked tsne shows that the yoked tsne change a little bit in first three images (1.16, 1.09, 1.04) and keep same distribution in others (among 1.0).

Next step, drawing the image for each epoch is too coarse to see the training process, we will change to drawing image for each several iteration.

NEW IDEA: using yoked t-sne to find how batch size affect some embedding methods.

1

In last week, I do an experiment on comparing embedding result between Npair loss and Proxy-loss, for testing yoke-tsne.

Npair loss is a popular method which try to push point in different class away and pull point in same class close (like triplet loss) , while the proxy loss just assign a specific place for each category and just push all points in this category in this place. I expect to see this difference on embedding result by yoked tsne.

In this experiment, which is same to last two, CAR dataset is split into two part, and I just train our embedding on the first part (by Npair and Proxy loss) and visualize it.

This result is as following (left part is Npari loss and right part is Proxy loss):

Here is the original one:

Here is the yoked one:

The yoked figures shows some interesting thing about those two embedding method:

First, In Npair Loss result, there are always some points in different class in cluster while are not in Proxy Loss. Those points should be very similar to the cluster, and the reason why the Proxy loss doesn't have such points is that the proxy fixed all points in one class to same place, so those points was moved into their own cluster. Next step, I will find corresponding image for those points.

Second, they are more clusters mixed up in proxy loss, maybe its shows that proxy play a bed performance in embedding.

Third, the corresponding clusters is in some place and comparing to the original one, the local relationship doesn't change too much.


Here is some interesting embedding paper which visualized by t-sne, if anyone know other paper, just write down in here.

[1]:Oh Song, Hyun, et al. "Deep metric learning via lifted structured feature embedding." Proceedings of the IEEE Conference on Computer Vision and Pattern Recognition. 2016. 

[2]:Oh Song, Hyun, et al. "Deep metric learning via facility location." Proceedings of the IEEE Conference on Computer Vision and Pattern Recognition. 2017.

[3]:Wang, Jian, et al. "Deep metric learning with angular loss." 2017 IEEE International Conference on Computer Vision (ICCV). IEEE, 2017.

[4]:Huang, Chen, Chen Change Loy, and Xiaoou Tang. "Local similarity-aware deep feature embedding." Advances in Neural Information Processing Systems. 2016.

[5]:Rippel, Oren, et al. "Metric learning with adaptive density discrimination." arXiv preprint arXiv:1511.05939 (2015).

[6]:Yang, Jufeng, et al. "Retrieving and classifying affective images via deep metric learning." Thirty-Second AAAI Conference on Artificial Intelligence. 2018.

[7]:Wang, Xi, et al. "Matching user photos to online products with robust deep features." Proceedings of the 2016 ACM on International Conference on Multimedia Retrieval. ACM, 2016.

Last experiment picked a particular lambda of yoke-tsne, and in this experiment, we pick up several lambda trying to see how lambda affect yoke-tsne.

As last experiment, we split Stanford Cars dataset in dataset A(random 98 categories) and dataset B(resting 98 categories). And, train Resnet-50 by N-pair loss on A, and get embedding points of those data in A. Second, train Resnet-50 by N-pair loss on dataset B, and using this trained model to find embedding points of data in dataset A. Finally, compare those two embedding effect by yoke-tsne.

In this measurement, with lambda change, we record the ratio between KL distance in yoke t-sne and KL distance in original t-sne, and record the L2 distance.

The result is as following:

We can see the KL distance ratio get an immediately increase when lambda is 1e-9. The yoke tsne result figure show that when lambda is 1e-8, the two result look like perfect aligned.

And, when lambda was downed to 1e-11, the yoke tsne seems no effect.

And, 1e-9 and 1e-10 works well, the training tsne get some local relation(between clusters) of testing one and keep the cluster inside relation:

Here is the original tsne:

Here is 1e-9:

Here is 1e-10:


In lambda 1e-9 1e-10, what is in our expectation, the location of each cluster is pretty same and the loose degree of each cluster was similar to the original t-sne.


For a reasonable lambda, I think it is depended on points number and KL distance between two embedding space.