Skip to content

We corrected our experiment from last week.

This time, we selected a subset of the 8x8 grid of the section we wanted (the truck). We then zero'd out the vectors for the rest of the 8x8. We then ran the similarity again, against another image from the same class. Here are the results (left is vector zero'd out besides for those squares determined to be on the truck, right is just another image from the class):

image_0 -> image_15 within the class

image_7 -> image_15 within the class (so we can capture the back of the truck)

So.. kinda? It *seems* like its paying attention to the text, or the top of the truck, but it doesn't seem to care about the back of the truck, which was surprising to us because we thought the back would stay in frame for the longest time.

We thought it might do better on small cars, so we tried this experiment as well:

We've been a little worried that the model is paying attention to the road more than the cars themselves, which this image corroborates?

This prompted another experiment, to see what it thinks about some generic piece of road. We just selected 1 tile of just road, and we wanted to see where it mapped.

Interestingly, the most similar portion was the road right around it, which was very confusing to us as well. Our hypothesis was that this generic piece of road would either: map to itself only (both are uncovered in these 2 pictures), or map to most other pieces of open road. A little miffed by this.

This week, we're still trying to see if the network is really learning something about the vehicles in our images.

We cropped one image with a big white truck:

'

We then ran the heatmap on this, against a different image in the same class (so it's LITERALLY the same truck).

Our hypothesis was that the ONLY possible thing in the image that could be similar between the two would be the trucks.

We ran this test a couple times, moving the cropped truck around and here were our results:

You can see... not great.

Some of our theories on why the model might not be so great at tracking cars is that it really only needs to pay attention to some things in the scene, not necessarily every single vehicle.

We're also thinking that, because our classes have frames that are very close together, the model always has a nearly identical image to look at. If we skip more frames between images in our classes, this could help this problem.

Our plans for next week are to:

  • Spread out the frames within our classes, so the model will have to keep track of cars over longer distances/ won't have another image that looks nearly identical
  • Get new data, with less traffic jams
  • Create long video of the highway

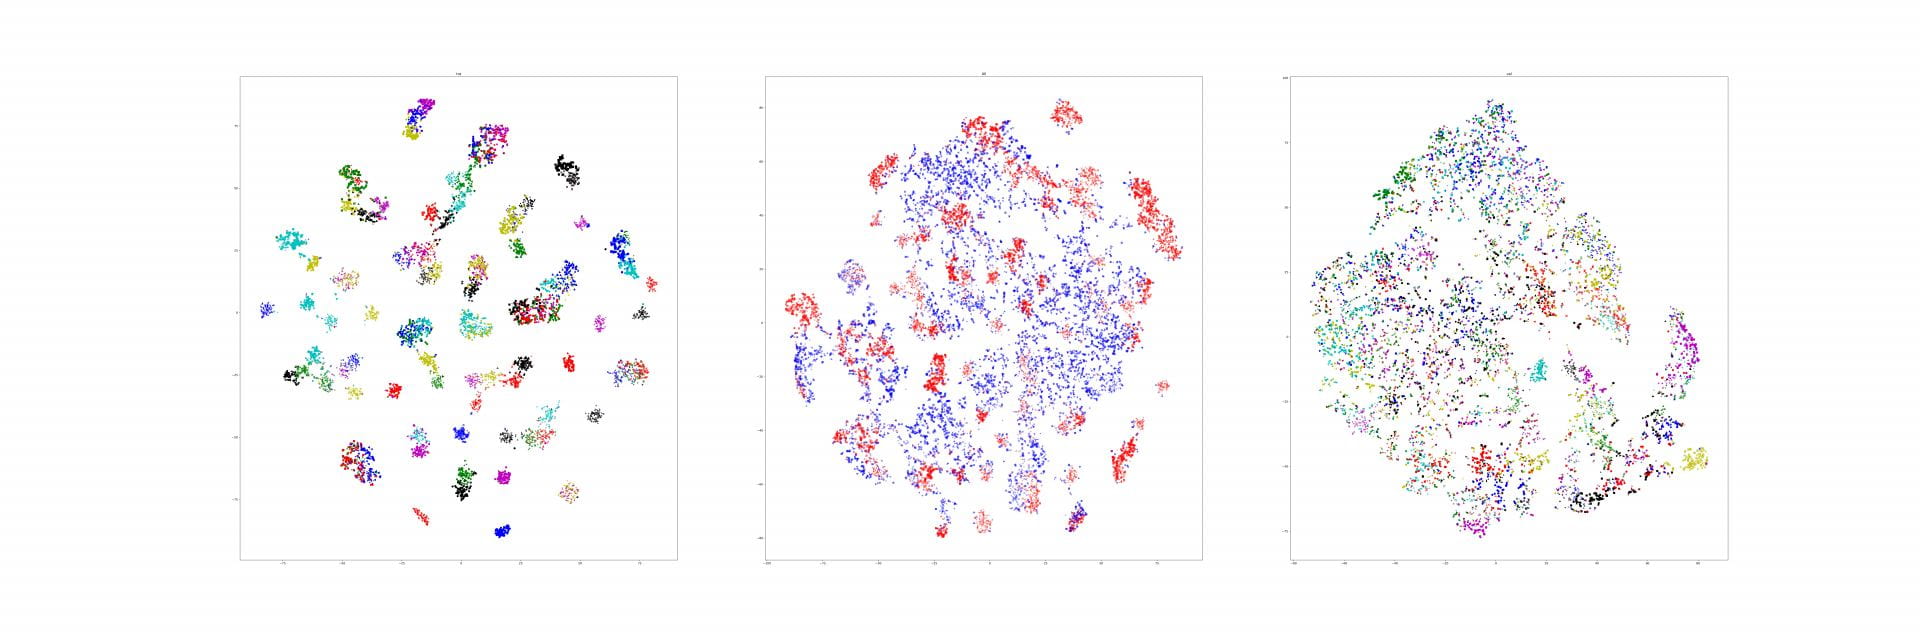
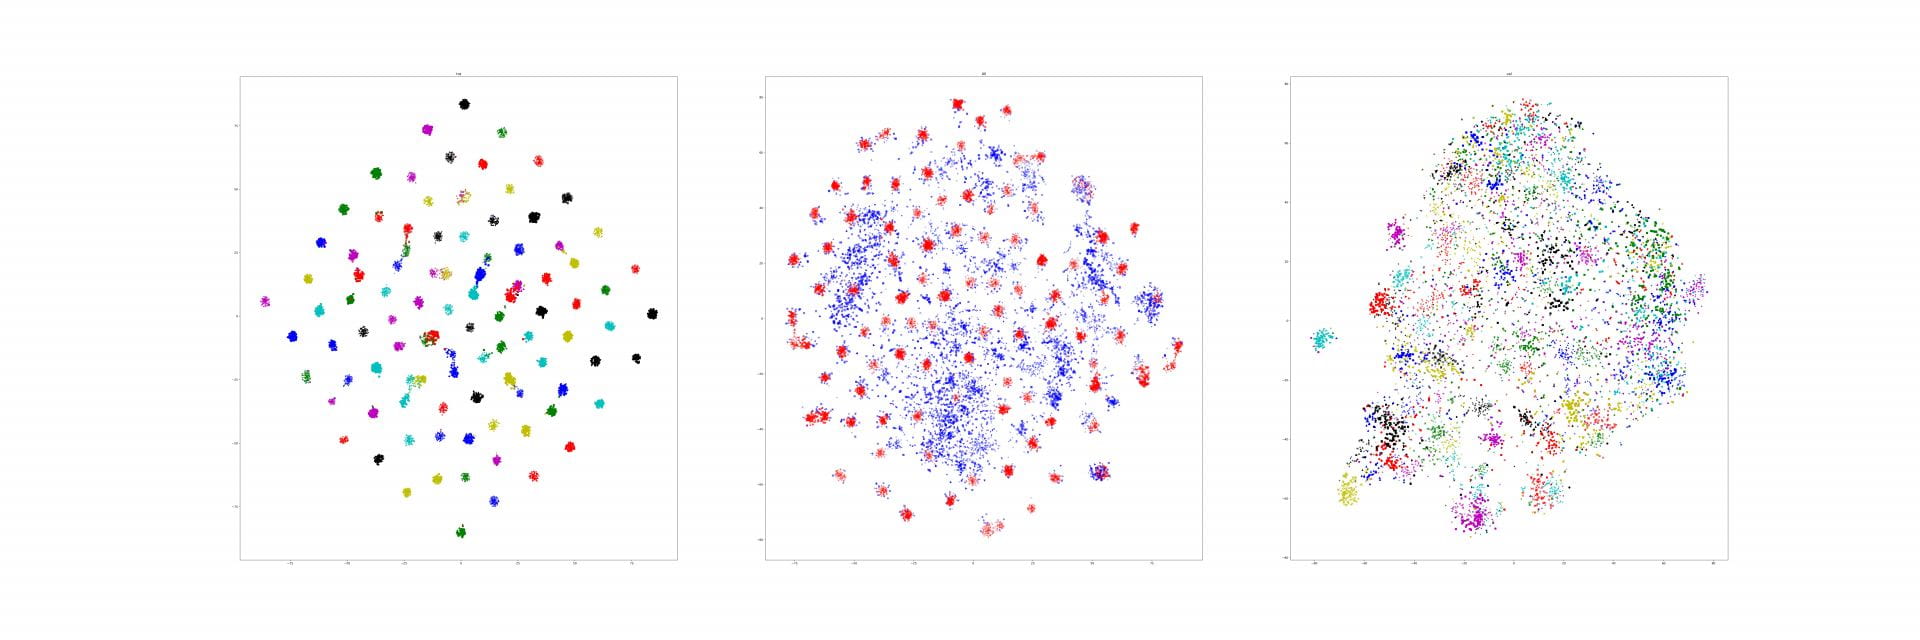
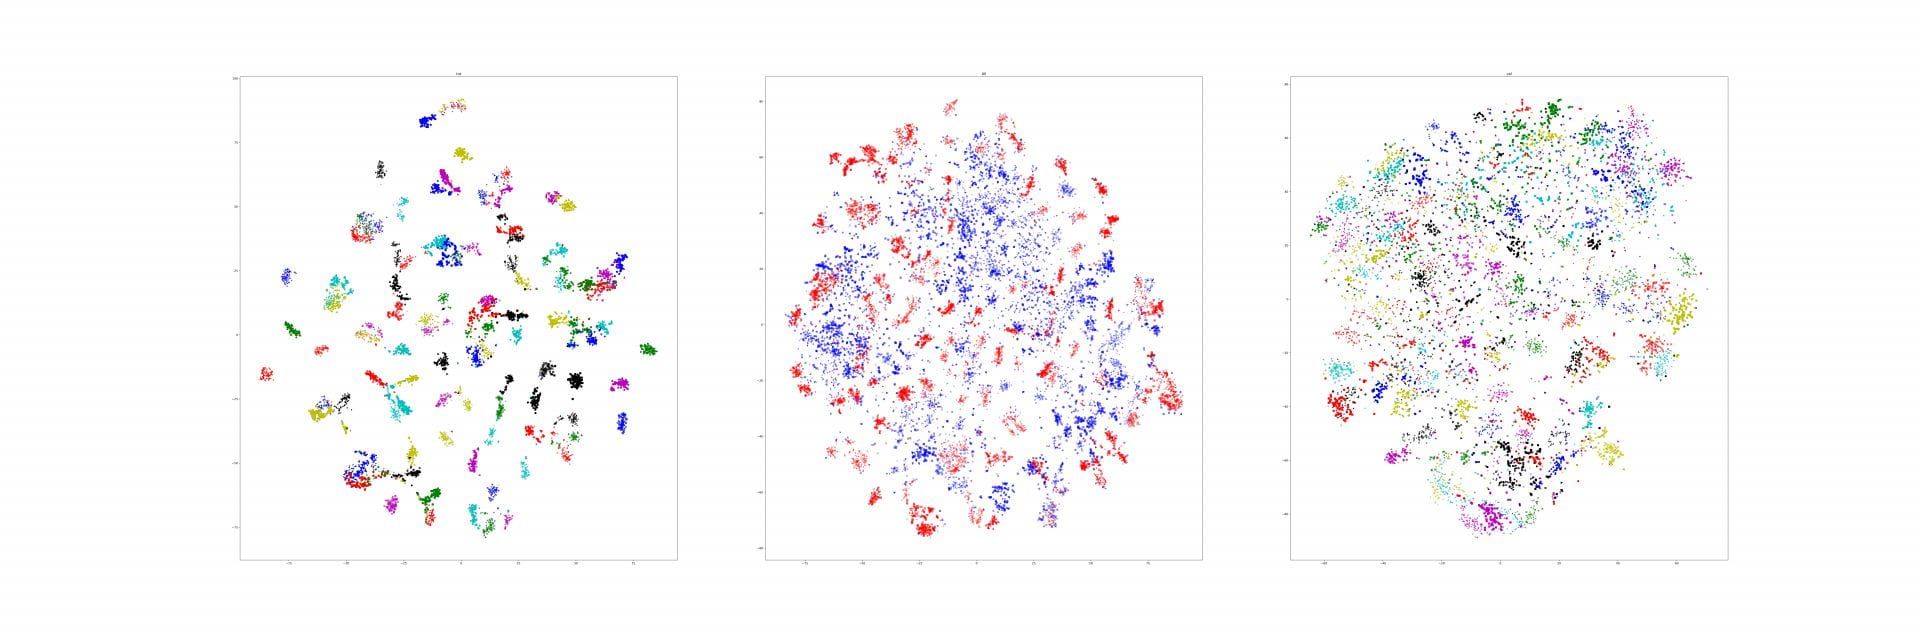
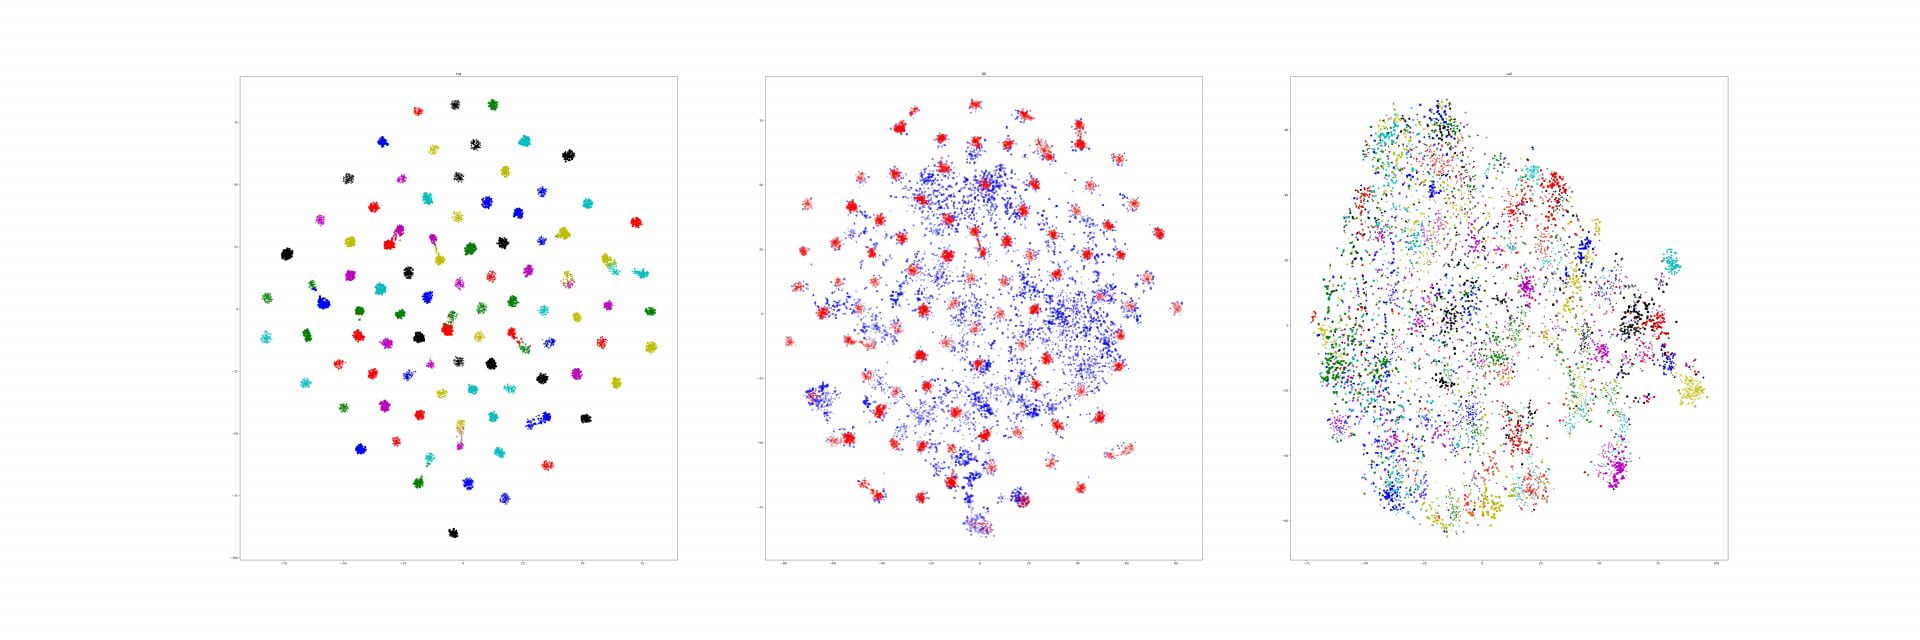
In order to figure out generalization ability of different embedding method, I get feature vectors of CAR dataset which is training by different loss function.

For all loss function, the dataset is split into training data (first 100 categories) and validation data (rest). and it will show the t-sne for training, testing and all data following:

1.  Lifted Structure (Batch All):  training on Resnet-18.

2. Triplet loss (Semi-Hard Negative Mining): training on Resnet-18.

3.Easy Positive Semi-Hard Negative Mining: training on Resnet-18.

4. Npair Loss : training on Resnet-18:

5. Histogram loss: training on Resnet-50:

1

With Hong and Abby's help, we were able to get the heatmap up and running on our model. Here you can see the similarity visualization across a couple of our classes as time passes (Left image is always the first image in the class, the right image advances timewise):

class80:

class120:

It appears as if these blobs are following groups of cars/ specific cars. Which would mean that it must be learning something about cars themselves. Its kinda hard to see how specifically it is paying attention to certain cars when they are close together, due to the fact that the resolution of the heatmap is 8x8.

One concern I have is that it only seems to care about some cars and not others. Would anyone have any insight as to why? This could mean that, if we were to use the embedding to identify cars for our amber-alert problem, we could get 'unlucky' and miss the car we actually care about.

Next week:

  • Do this visualization on our training data too
  • Figure out our next steps

1

In order to accomplish our goal of figuring out which pictures were being misplaced by our embedding network, we took some time to introspect on Hong's model accuracy calculation function. In doing this we learned/ confirmed some things about how the linear algebra behind embedding works!

We saw how, by multiplying the high dimensional space vector by its transpose, will give us the distance from each vector to every other vector. We then sort to find the closest vector to each other vector. We set the prediction of the given vector to whatever the class is of the closest other vector to it.

Here is an example image that the network misclassified (raw image on left, highlighted similarities on right):

Test Image (from ~1min from video start):

Closest image in High dimensional space (from ~30min from video start):

Here are the images again with some highlighted similarities:

Test Image:

Predicted image (closest in high-dimensional space):

Another similarity we saw was the truck in the far right lane, and far left lane. They look fairly similar, and it would be reasonable for them to be this far apart within the time period of one of our classes.

The first glaring issue we saw were the trucks/ lack of trucks in the bottom left. We then thought it may be fine, because it makes sense that, within a class it is likely for new vehicles to enter the scene from this point, so the model might allow for a situation like this.

We attempted to use the heatmap, we have most of it set up, we gave it a first attempt, but we just think we are plugging in the wrong vectors as input. (we can talk to Hong/ Abby more about this). Here is our first attempt (lol):


Next week:

  • Find the right vectors to use for our heatmap to confirm the car-tracking ability of the model

This week we focused on making small improvements to our process/ model.

We fixed our training/test set so there is a time gap between the training and test classes. Before, the last image in each training class would have been directly adjacent, time-wise, to the first image in one of the testing classes. While validating, this would mean that some of the images would be almost identical to images it has already seen in training.

We also did some of the other tests, like the overfitting test to see that the loss went to 0, and it did.

Another issue, which we posted about before, was that we were getting our training accuracy to be 0. We found this .......

acc_tra = 0#recallAcc(Fvec_tra, dsets_tra.idx_to_class)  (oof)

Our goal is also to see some of the images that the network is getting wrong (what class did the network guess/ what class is it supposed to be). We're close to getting this done. Part of the code maps an arbitrary class name to a specific index ('dog' -> class 7).  We were able to obtain this specific index of the expected/actual of the incorrectly labelled images. All that's left is to translate this index back into the original class names. Then we can see guessed/actual of the wrong images.

We also switched our model over to resnet50 (previously resnet18), and retrained over 10 epochs.


For next week:

  • Finish up checking out mislabelled images
  • Use Abby's heatmap to visualize similarity within a class (to confirm the model is 'tracking cars')

Just a reminder on what we are doing, we are embedding images of a highway, where images within a small timespan window are mapped to a certain class.

Since our last post, we mainly focused on creating a TSNE and visualizations of our embedding.

Dr. Pless gave us an idea for our tsne: plot a line between all the points (where the line goes in temporal order).

First we created our tsne, and observed that all the clusters were more or less in a line.

And we were like "hey, wouldn't it be cool if these cluster-lines represent the timeline of the images within the class", and it looks like they actually are!

If these line-clusters were to represent the timeline of the images, we would expect that our temporally-advancing line would enter a cluster at one end, would continue 1 by 1, in order of the line-cluster, and exit out the other end.

This would be impressive to me, because the embedding is not only learning the general timeframe of the image (class), but also the specific time within that class, even though it has no knowledge of this time beforehand.

Here are the results on our training data (click on the image if you don't see the animation):

Here are the results on our validation data:

You can see this isn't quite as nice as our training data (of course). The line generally comes in to one end, and most of the time exits the cluster in the middle-ish.

(this was a model only trained for a couple epochs, so we should get better results after we train it a bit more)


For next week we plan to:

- Correct our training and test sets (previously we mentioned taking every other time interval as part of our evaluation set. This is bad because our test set is too close to our training set (the end of one training time window = start of one evaluation time window)

- Do some of the overfitting test/ etc. that we did last model

- Train more!

1

We started this week attempting to fix our weird batch size bug. We talked to Abby, and we determined that this (probably) some weird Keras bug. Abby also recommended that we switch to PyTorch, to stay consistent within the lab, and to avoid this weird bug.

Hong sent us his code for NPair loss, which we took a look at, and started to modify it to work with our dataset. However, its not as easy as just swapping in our images. Hong's model works by saying "we have N classes with a bunch of samples in each, train so X class is grouped together, and is far away from the other N-1 classes". The problem for us is that each images by itself is not in any class. It's only in a class relative to some other image (near or far). We believe our options for the loss function are this:

  1. Change N pair loss to some sort of thresholded N pair loss. This would mean the negatives we would be pushing away from would be, some fraction of the dataset we determine to be far away (for now I'll say 3/4).

if these are the timestamps of the images we have, and we are on image [0]:

[0, 1, 2, 3, 4, 5, 6, 7, 8, 9]

The loss would try to push [0] close to [1, 2, 3] (the images we defined to be close to it, time-wise), and far away from images [4, 5, 6, 7, 8, 9].

1a. We could make this continuous instead of discrete (which I think makes more sense). Where the loss is proportional to the distance between the timestamps

2. Implement triplet loss in pytorch.

(Please let us know if this doesn't make any sense/ we have a fundamental misunderstanding of what we are doing)

Since last week, we gathered 20000 images. We visualized the triplets to ensure that our triplet creation code was working correctly. We discovered that the last 5000 images we were using were actually from a boat camera instead of the highway cam (we used a youtube video which must have autoplayed). So we had to cut down the images to 15000. We visually verified the triplet creation was correct for the rest of the images.

We also realized that our code was extra slow because we were loading the original resolution images and resizing all 15000 each time we ran. We took some time to resize and save all images beforehand, that way we don't have to waste time resizing every run.

We also had a quick issue where cv2 wasn't importing. We have absolutely no idea why this happened. We just reinstalled cv2 in our virtual environment and it worked again.

We are getting some weird errors when training now. We are a little confused as to why. For some reason, it appears that we need a batch size divisible by 8. This isn't so bad, because we can just choose a batch size that IS divisible by 8, but we just aren't sure WHY. If we don't do this we get an error that says: `tensorflow.python.framework.errors.InvalidArgumentError: Incompatible shapes: [8] vs. [<batch_size>]`. Has anyone seen this error before?

We modified our code a bit, to use ResNet without the softmax layer on the end. We then did our 'over training check', by training on a minimal number of triplets, to ensure the loss went to 0:

We then tried a test with all of our data (~500 images), to see if our loss continued to decrease:

One thing we found interesting is that when we train with all of our data, the val_loss converges to the margin value we used in our triplet loss (in this example margin = 0.02, and in other examples where we set margin=0.2, val_loss -> 0.2).

We believe this could be troubling if you look at this equation for triplet loss (https://omoindrot.github.io/triplet-loss):

L=max(d(a,p)d(a,n)+margin,0)

It appears to me that the only way for L = margin is if the distance from the anchor to the positive is the exact same as the distance from the anchor to the negative, whereas we want the positive to be closer to the anchor than the negative.

Dr. Pless recommended that we visualize our results to see if what we are training here actually means anything, and to use more data.

We set up our data-gathering script on lilou, which involved installing firefox, flash, and selenium drivers. The camera that we were gathering from before just happened to crash, so we spent some time finding a new camera. We are currently gathering ~20,000 images from a highway cam that we'll use to train on.

After this we will visualize our results to see what the net is doing. However we are a bit confused on how to do this. We believe that we could pass a triplet into the net, and check the loss, but after that, how could we differentiate a false positive from a false negative? If we get a high loss, does this mean it is mapping the positive too close to the anchor, or the negative too far from the anchor? Do we care?

Is there some other element to 'visualization' other than simply looking at the test images ourselves and seeing what the loss is?