Skip to content

This lab is trying an experiment --- a distributed approach of exploring following idea:

"Given many images of one scene, predicting the time an image was taken is very useful. Because you have to have learned a lot about the scene to do that well, the network must learn good representations to tell time, and those are likely to useful for a wide variety of other tasks"

So far we've made some progress (which you can partially follow in the #theworldisfullofclocks slack channel), with a start on framing the problem of: Given many images of a scene, how can you tell what time it is?

This google doc already lays out what are reasonable approaches to this problem. Here I want to share some visualizations that I want to make as we try to debug these approaches. These visualizations are of the data, and of the results of the data.

  • An annual summary montage, with rows organized as "day of the year" and columns organized as "time of day" (maybe subselecting days and times to make the montage feasible)
  • A daily summary montage with *all* the images from on day of a camera shown in a grid.
  • An "average day" video/gif that shows the average 7:00am image (averaged over all days of the year), and average 7:10a image... etc.

Kudos to everyone who has started to work on this; I think we have some good ideas of directions to go!

Hi everyone,

Here are a list of 20 fantastic! blogs about current machine learning research.

David Ahmadovhttps://blogs.gwu.edu/ahmedavid/
Farida Aliyevahttps://blogs.gwu.edu/ffaliyeva2022
Leyla Aliyevahttps://blogs.gwu.edu/leylaaliyeva
Ibrahim Alizadahttps://blogs.gwu.edu/ibrahim_alizada
Mustafa Aslanovhttps://blogs.gwu.edu/aslanovmustafa
Aydin Bagiyevhttps://blogs.gwu.edu/abagiyev
Aygul Bayramova https://blogs.gwu.edu/abayramova99/
Samir Dadash-zadahttps://blogs.gwu.edu/samirdadashzada
Habil Gadirlihttps://blogs.gwu.edu/hgadirli
Farid Jafarovhttps://blogs.gwu.edu/fjafarov
Narmin Jamalovahttps://blogs.gwu.edu/njamalova54
Steve Kaislerhttps://blogs.gwu.edu/skaisler/
Ilyas Karimovhttps://blogs.gwu.edu/ilyaskarimov
Kheybar Mammadnaghiyevhttps://blogs.gwu.edu/mammadnaghiyevk
Fidan Musazadehttps://blogs.gwu.edu/fmusazade
Natavanhttps://blogs.gwu.edu/ntakhundova/
Aykhan Nazimzadehttps://blogs.gwu.edu/anazimzada2020
Robert Plesshttps://blogs.gwu.edu/pless
Jalal Rasulzadehttps://blogs.gwu.edu/jrasulzade
Kamran Rzayevhttps://blogs.gwu.edu/kamran_rzayev
Ismayil Shahaliyevhttps://blogs.gwu.edu/shahaliyev

  1. There is a camera at the Tufandag Ski resort:

https://www.tufandag.com/en/skiing-riding/webcam/#webcam1

I think it shows video, and maybe there is a way to get a "live" still image from it. What can you do from many videos of this webcam? For example: can you predict the live weather parameters (wind speed or direction?) ? Can you highlight anomalous behaviors? Can you make a 3D model of that scene? For each of these problems, can you answer the Heilmeyer questions for this?

What could you do with many images from bird nest cameras?

There are YouTube streams of one box: https://www.youtube.com/watch?v=56wcz_Hl9RM and pages where you could write a program to save images over time: http://horgaszegyesulet.roszkenet.hu/node/1

2. Some live cameras give streams of audio and video:

(Many examples)

https://hdontap.com/index.php/video/stream/pa-farm-country-bald-eagle-live-cam

https://www.youtube.com/watch?v=2uabwdYMzV

Live Bar Scene

https://www.webcamtaxi.com/en/sound.html (tropical murphy's bar is good).

There is relatively little Deep Learning done that tries to think about one camera over very long time periods. Can you predict the sound from the video stream? Can you predict the video stream from the sound? Can you show the part of the image that is most correlated with the sound? Can you suppress the part of the sound that is unrelated to the video?

3. Some places give live video + text.

Twitch feeds have chat windows that are loosely aligned with the video. Live YouTube feeds also have a text chat.

There is *lots* of work right now trying to merge the analysis of text and video, but very little that is done for one specific viewpoint or event. Can you build a system to:
(a) predict the chat comments that will come up from a video stream (given that you can train on *lots* of video from that specific video stream),

(b) Can you identify times in the video that will have more or less text?

(c) Can you show what part of the video is related to a text comment?

4. COVID image datasets

https://datascience.nih.gov/covid-19-open-access-resources

https://wiki.cancerimagingarchive.net/display/Public/COVID-19

I'm Robert Pless --- chair of the Computer Science Department at GWU, and I'd like to briefly introduce myself.

I was born in Baltimore, Maryland and have lived also in Columbus, Ohio, and Washington D.C. and Warsaw, Poland (although I was 4 at that time).

Within Computer Science, I work mostly on problems in Computer Vision (trying to automatically understand images), and Computational Geometry (building data structures for points and lines and shapes in space), and Machine Learning. A few of my favorite papers that I've written are here.

I'm especially interested in problem domains where new algorithms can help to improve social justice, healthier interactions with social media, and medical image understanding.

Outside of Computer Science, I have a four-and-a-half year old daughter who is learning to argue more and more effectively, and a grumpy dog. I'm interested in ultimate frisbee and modern art. My favorite artists are Dan Flavin and David Hockney, and I've written papers about the Art of Hajime Ouchi and Isia Leviant.

Sometimes I like being a contrarian.  This paper (https://arxiv.org/pdf/1904.13132.pdf) suggests that you can train the low levels of a Deep Learning network with just one image (and a whole mess of data augmentation approaches, like cropping and rotating etc.).  This contradicts a huge amount of belief in the field that the reason to pre-train on Imagenet is that having a large number of images makes for a really good set of low level features.

I'm curious what other assumptions we can attack, and how?

One approach to data augmentation is to take your labelled data, and make *more* labelled data by flipping the images left and right and/or crop it and use the same label for the new image.  Why are these common data augmentation tools?  Because often flipping an image left right (reflecting it), or slight crops result in images that you'd expect to have the same label.

So let's flip that assumption around.  Imagine training an binary image classifier with many images that are labelled either (original or flipped).  Can a deep learning network learn to tell if something has been flipped left/right?  And if it does; what has it learned?  Here is an in-post test.  For these three images (the first three images that I see when I looked at facebook today), either the top or the bottom has been flipped from the original.  Can you say which is the original in each case?

[(Top, bottom, bottom)]

Answers available by highlighting above.

What cues are available to figure this out?  What did you use?  Could a network learn this?   Would it be interesting to make such a network and ask what features in the image it used to come to its conclusion?

What about the equivalent version that considers image crops?  (binary classifier: is this a cropped "normal picture" or not?  Non binary classifier: Is this cropped from the top left corner or the normal picture?  the top right corner?  the middle?)

What are other image transformations that we usually ignore?


The internet is a strange place.  I've talked about using reaction videos as a set of free labels (Learn a Deep Network to map faces to an embedding space where images from the same time in an aligned video are mapped to the same place).  Why is that good?  There are lots of works on emotion recognition, but it is largely limited to "Happy" or "Sad" or "Angry", and often recognition works with pretty extreme facial expressions.  But real expressions are more subtle, shaded, and interesting.  But usually nobody uses them because there are no labels.  We don't have strong labels, but we have weak labels (these images should have the same label).

And, lucky us!  Someone has made a reaction video montage, like the one above, aligning all the videos already!  (crazy!).

Not just one, here is another:

and, not just 2, but literally hundreds of them:

https://www.youtube.com/channel/UC7uz-e_b68yIVocAKGdN9_A/videos


Blog Post:

I’ve done lots of work on “embedding” over the last 20 years.  In the early 2000’s this was called “manifold learning” and the goal was to do something like t-SNE:

Given a collection of images (or other high-D points) --- that you *think* have some underlying structure or relationship that you can define with a few parameters --- map those images into a low-dimensional space that highlights this structure.

Some of my papers in this domain are here.  

https://www2.seas.gwu.edu/~pless/publications.php?search=isomap

This includes papers that promote the use of this for temporal super-resolution, using that structure to help segmentation of biomedical imagery, and modifications to these algorithms if the low-dimensional structure had cyclic structure (for example, if the images are of an object that has rotated all the way around, you want to map it to a circle, not a line).  

Algorithms like Isomap, LLE, t-SNE and UMAP all follow this model.  They take as input a set of images and map those images to a 2 or 3 dimensional space where the structure of the points is, hopefully, apparent and useful.  These algorithms are interesting, but they *don’t* provide a mapping from any image into a low-dimensional space, they all just map the specific images you give them into a low dimensional space.  It is often awkward to map new images to the low dimensional space (what you do is find the closest original image or two close original images and use their mapping and hope for the best).

These algorithms also assume that for very nearby points, simple ways of comparing points are effective (for example, just summing the difference of pixel values), and they try to understand the overall structure or relationship between points based on these trusted small distances.  They are often able to do clustering, but they don’t expect to have any labelled input points.

What I learned from working in this space is the following:

  1. If you have enough datapoints, you can trust small distances.  (Yes, this is part of the basic assumption of these algorithms, but most people don’t really internalize how important it is).
  2. You *can’t possibly* have enough datapoints if the underlying structure has more than a few causes of variation (because you kinda need to have an example of how the images vary due to each cause and you get to an exponential number of images you’d need very quickly).
  3. You can make a lot of progress if you understand *why* you are making the low-dimensional embedding, by tuning your algorithm to the application domain.

What does this tell us about our current embedding work?  The current definition of embedding network has a different goal:  Learn a Deep Learning network f that maps images onto points in an embedding space so that:

|f(a) - f(b)| is small if a,b are from the same category

and

|f(a) - f(b)| is large of a,b are from different categories.

This differs from the previous world in two fundamental ways:

  1. We are given labels that help tell us where our points should map to (or at least constraints on where they map), and
  2. We care about f(c) ... where do new points map?
  3. Usually, we don’t expect the original points to be close (in terms of pixel differences or other *easy* distance functions in the high dimensional space.

So we get extra information (in the form of labels of which different images should be mapped close to each other), at the cost of our input images maybe not being so close in their original space, and requiring that the mapping work for new and different images.

Shit, that’s a bad trade.

So we don’t have enough training images to be able to trace out clean subsets of similar images based on follow super similar images (you’d have to sample cars of many colors, in front of all backgrounds, with all poses, and all collections of which doors and trunks are open)

So what can you do?

Our approach\ (Easy-Positive) is something like “hope for the best”.  We force the mapping to push the closest images of any category towards each other, and don’t ask the mapping to do more than that.  Hopefully, this allows the mapping to find ways to push the “kinda close” images together. Hopefully, new data from new classes are also mapped close together.

What are other approaches?  Here is a just-published to ArXiv paper that tries something: https://arxiv.org/pdf/1904.03436.pdf.  They say, perhaps there are data augmentation steps (or ways of changing the images) that you *really* don’t believe should change your output vector.  These might include slight changes in image scale, or flipping the image left/right, or slight skews of the image.

You could take an *enormous* number of random images, and say “any two images that are a slight modification of each other” should have exactly the same feature vector, and “any two images that are different should have different feature vectors.

This could be *added* to the regular set of images and triplet loss used to train a network and it would help force that network to ignore the changes that are in your data augmentation set.  If you care most about geometric transformations, and really like formal math, you could read the following (https://arxiv.org/pdf/1904.00993.pdf).

The other thing we can, or tool that we can use to try to dig deeper into the problem domain, is ask more "scientific" questions.  Some of our recent tools really help with this.

Question: When we “generalize” to new categories, does the network focus on the right part of the image?

How to answer this:

  1. Train a network on the training set.  What parts of the image are most important for the test set?
  2. Train a network on the TEST set.  What parts of the image are most important for the test set?
  3. We can do this and automatically compare the results.
  4. If the SAME parts of the image are important, then the network is generalizing in the sense that the features are computed on the correct part of the image.

This might be called “attentional generalization”.

Questions: If the network does focus does focus on the right part of the image, does it represent objects in a generalizable way?

How to answer this:
Something similar to the above, with a focus on image regions instead of the activation across the whole image.

This we might call “representational generalization" or "semantic generalization”

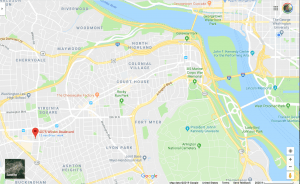
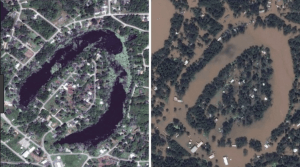
Tuesday and Wednesday I sat in a building in Ballston VA (just a few metro stops away) for the "Phase 2 kickoff meeting" for the Geo-spatial Cloud Analytics program.  James is leading our efforts towards this project, and our goal is to use nearly-real-time satellite data to give updates traversability maps in areas of natural disasters (e.g. Think "Google maps routing directions that don't send you through flood waters).

Special note 1: Our very own Kyle Rood is going to be interning there this summer, working on this project!

Many of the leaders of teams for this project "grew up" the same time I did ... when projects worked with thousands of points and thousands of lines of matlab code.  Everyone is now enamored with Deep Learning.... and share stories about how their high-school summer students do amazing things using the "easy version" of Deep Learning, using mostly off the shelf tools.

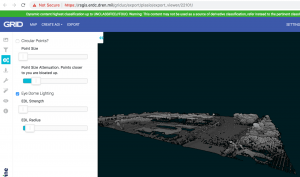
The easy version of Deep Learning relies on absurd amounts of data; and this project (which considers satellite data) and absurdly absurd amounts of data.  In the Houston area, we found free LIDAR from 2018 that, when rendered, looks like this:

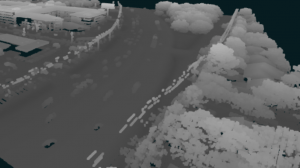
and zooming in:

This scale of data (about 15cm resolution LIDAR) is available for a swath that cuts across Houston.

This data is amazing!  and there is so much of it.  Our project has the plan to look at flooding imagery and characterize which roads are passible.

We've always known the timeline of this project was very short; but we have an explicit demo deadline of November (which means we need to deliver our code to DZyne much sooner).  So:
(a) we may consider first run options that do less learning and rely more on high-resolution or different data types to start, and

(b) the satellite data is *amazing* and we should think about which of our algorithms might be effective on these datatypes as well.

2

This post has several purposes.

FIRST: We need a better name or acronym than yoked t-sne.  it kinda sucks.

  1. Loosely Aligned t-Sne
  2. Comparable t-SNE (Ct-SNE)?
  3. t-SNEEZE? t-SNEs

SECOND: How can we "t-SNEEZE" many datasets at the same time?

Suppose you are doing image embedding, and you start from imagenet, then from epoch to epoch you learn a better embedding.  It might be interesting to see the evolution of where the points are mapped.  To do this you'd like to yoke (or align, or tie together, or t-SNEEZE) all the t-SNEs together so that they are comparable.

t-SNE is an approach to map high dimensional points to low dimensional points.  Basically, it computes the similarity between points in high dimension, using the notation:

P(i,j) is (something like) how similar point i is to point j in high dimensions --- (this is measured from the data), and

Q(i,j) is (something like) how similar point i is to point j in low dimension.

the Q(i,j) is defined based on where the 2-D points are mapped in the t-SNE plot, and the optimization finds 2-D points that makes Q and P as similar as possible.  Those points might be defined as (x(i), y(i)).

With "Yoked" t-SNE we have two versions of where the points go in high-dimesional space, so we have two sets of similarities.  So there is a P1(i,j) and a P2(i,j)

yoked t-SNE solves for points x1, y1 and x2,y2 so that the

  1. Q1 defined by the x1, y1 points is similar to P1, and the
  2. Q2 defined by the x2,y2 points are similar to P2 and the
  3. x1,y1 points are similar to x2,y2

by adding this last cost (weight by something) to the optimization.  If we have *many* high dimensional points sets (e.g. P1, P2, ... P7, for perhaps large versions of "7") what can we do?

Idea 1: exactly implement the above approach, with steps 1...7 talking about how each embedding should have Q similar to P, and have step 8 penalize all pairwise distances between the x,y embeddings for each point.

Idea 2: (my favorite?).  The idea of t-SNE is to find which points are similar in high-dimensions and embed those close by.  I wonder if we can find all pairs of points that are similar in *any* embedding.  So, from P1... P7, make Pmax, so that Pmax(i,j) is the most i,j are similar in any high-dimensional space.  Then solve for each other embedding so that it has to pay a penalty to be different from Pmax?  [I think this is not quite the correct idea yet, but something like this feels right.  Is "Pmin" the thing we should use?]


1

Welcome to our lab blog!

We build cameras, algorithms, and systems that analyze images to understand our world in new ways.  This page helps keep our lab organized:

Upcoming Conferences

Lab Members

Science and engineering thrives on diverse perspectives and approaches. Everyone is welcome in our lab, regardless of race, nationality, religion, gender, sexual orientation, age, or disabilities. Scientists from underrepresented groups are especially encouraged to join us.​