Skip to content

One of the fundamental challenges and requirements for the GCA project is to determine where water is especially when water is flooding into areas where it is not normally present.  To this end, I have been studying the flooding in Houston that resulted from hurricane Harvey in 2017.  One of the specific areas of interests (AOI) is centered around the Barker flood control station on Buffalo Bayou.

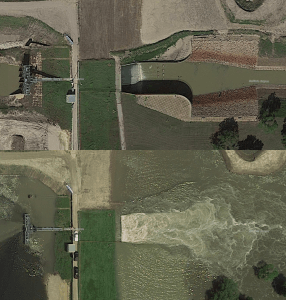
To get an understanding of the severity of the flooding in this area, this is what the Barker flood control station looked like on December 21, 2018...

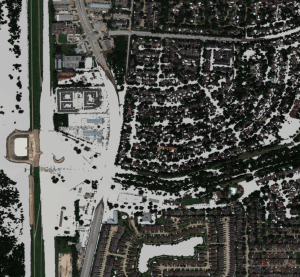
And this is what the Barker flood control station looked like on August 31, 2017...

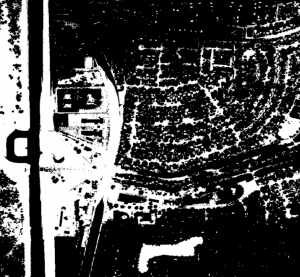
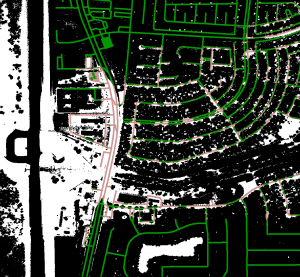
Our project specifically explores how to determine where transportation infrastructure is rendered unusable by flooding.  Our first step in the process is to detect where the water is.  I have been able to generate a water mask by using the near infrared band available on the satellite that took these overhead photos.  This rather simple water detection algorithm produces a water mask that looks like this...

If the mask is overlayed onto the flooded August 31, 2017 image, it suggests that this water detection approach is sufficient for detecting deep water...

There are specific areas of shallow water that are not detected by the algorithm; however, parameter tuning increases the frequency of false positives.  There are other approaches that are available to us; however, our particular contribution to the project is not water detection per se and other contributors are working on this problem.  Our contribution is instead dependent on water detection, so this algorithm appears to be good enough for the time being.  We have already run into some issues with this simplified water detection, namely that trees obscure the sensor which causes water to not be detected in some areas.

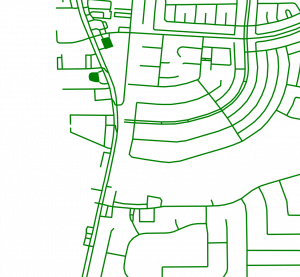
Besides water detection, our contribution also depends on road networks.  Again, this is not a chief contribution of our project and others are working on it; however, we require road information to meet our goals.  To this end, we used Open Street Maps (OSM) to pull the road information near the Barker Flood Control AOI and to generate a mask of the road network.

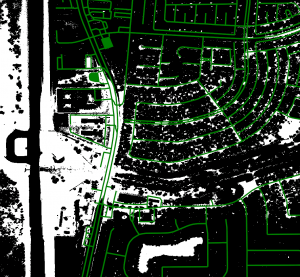
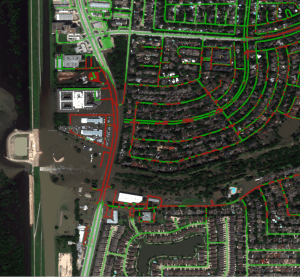
By overlaying the road network onto other imagery, we can start to see the extent of the flooding with respect to road access.

Our contribution looks specifically at road traversability in flooded areas, so by intersecting the water mask generated through a water detection algorithm with the road network, we can determine where water covers the road significantly and we can generate a mask for each of the passable and impassible roads.


The masks can be combined together and layered over other images of the area to provide a visualization of what roads are traversable.

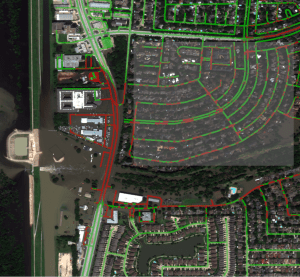
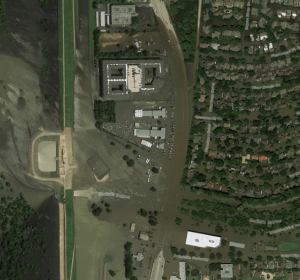
The big caveat to the above representations is that we are assuming that all roads are passable and we are disqualifying roads that are covered with water.  This means that the quality of our classification is heavily dependent on the quality of water detection.  You can see many areas that are indicated to be passable that should not be.  For example, the shaded box in the following image illustrates where this assumption breaks down...

The highlighted neighborhood in the above example is almost entirely flooded; however, the tree cover in the neighborhood has masked much of the water where it would intersect the road network.  There is a lot of false negative information, i.e. water not detected and therefore not intersected, so these roads remain considered traversable while expert analysis of the overhead imagery suggests the opposite.

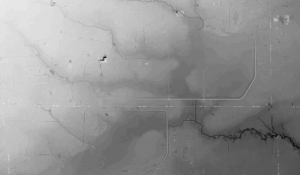
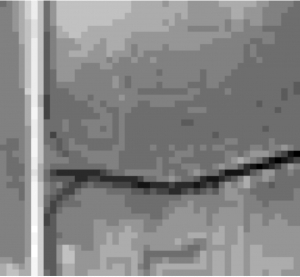
We are also combining our data with Digital Elevation Models (DEM) which are heightmaps of the area which can be derived from a number of different types of sensor.   Here is a heightmap from the larger AOI that we are studying derived from the Shuttle Radar Topography Missions (SRTM) conducted late in the NASA shuttle program.  This is a sample from the SRTM data of the larger AOI we are studying...

Unfortunately, the devil is in the details and the resolution of the heightmap within the small Barker Flood Control AOI is very bad...

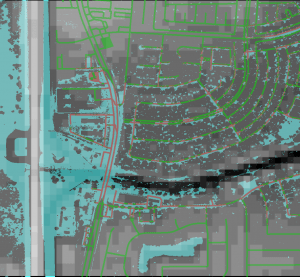
A composite of our data shows that the SRTM data omits certain key features, for example the bridge across Buffalo Bayou is non-existent and that our water detection is insufficient, the dark channel should show a continuous band of water due to the overflow.

The SRTM data is unusable for our next steps, so we are exploring DEM data from a variety of sources.  Our goal for the next few days is to assess more of the available and more current DEM data sources and to bring this information into the pipeline.
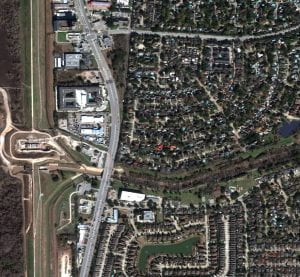
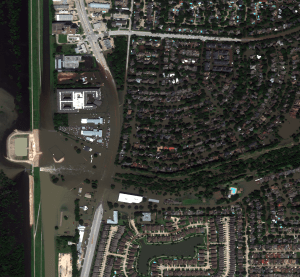
 

The flooding in Houston associated hurricane Harvey was primarily due to release from the Addicks and Barker reservoirs which flooded the Buffalo Bayou river.

The dramatic change in water level in Buffalo Bayou is best illustrated by photos taken above the Barker Reservoir flood control station before and immediately after the hurricane struck.

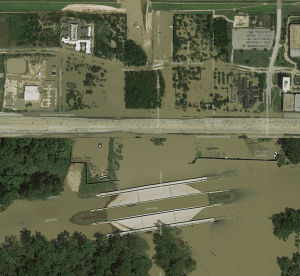
Our project is driven by the need to determine the water depth over roadways.  The impact of the Barker flood release on the local infrastructure is illustrated by the flooding over Hwy 6 which is adjacent to the Barker flood control station and passes over Buffalo Bayou.

Our problem specifically involves developing a metric that we can use to determine whether a road is passable or not.  While a quantifiable metric would be most desirable, we expect quantification to be difficult.  We have considered a metric involving a set of classes: dry, wet, flooded; however, these are still difficult classifications to develop from purely optical data.

One idea that we have kicked around is that we can see road markers in relatively shallow water and as the water depth increases, the opacity of the water rapidly increases due to the turbidity of flood waters; however, our intuition suggests that this approach will encounter difficulties because as water settles, the sediments will ultimately obscure road markings regardless of the depth.  The following pictures are close-ups of the Hwy 6 area around Buffalo Bayou.

We can clearly see where the water line is in the above pictures, and we believe that this is information that we can train on with a human in the loop.

When Nick found out that my background is computer simulation, he proposed that we use elevation models (DEM or LIDAR data) to simulate water movement in an area.  I was not too receptive to the idea because water simulations can be really complex problems dependent on Computational Fluid Dynamics (CFD) which may require massive computing resources.  The important consideration from this discussion though was the potential inclusion of DEM data into our training regime.

We believe that we can incorporate the elevation data with optical data to determine water depth based on the assumption that the "localized sea level" is roughly constant.  If we locate the water line in a number of locations, we can use that elevation to define the localized sea level and can then determine depth of features throughout the local area.

Some infrastructure may be of particular interest.  For example, the central span of bridges are level for structural reasons.  The following image shows the Park Row bridge over the Addicks reservoir outlet.

1

I now have access to all of the satellite platforms that will be used with the GCA project and I have begun familiarizing myself with the platforms.  I will be attending training seminars for two of the platforms, today and tomorrow, to get a deeper understanding of the systems.

I also have a meeting with Nick Tom at DZYNE today to discuss the metric in preparation for the Phase 2 kickoff meeting presentation scheduled for March 12 and 13.  We also have a government meeting scheduled for Monday March 4.  These appointments are reflected in the GCA calendar.

Robert and I discussed the metric that was proposed in preparation for meeting with Nick over the metric.  Our current plan is for me to focus this upcoming week on gathering data to support the presentation of that metric at the Phase 2 kickoff meeting.  At this point, the data we are looking for is a range of images that support classification of traversability of a road, e.g. dry, wet (no accumulation), 2" deep, 6" deep, undrivable (boating depth).

Last week Robert and I met to discuss the project.  While we are funded under the overall grant, our category is more freely categorized as "suggest your own".

The primary team has a general focus on hurricanes; however, we are all keenly aware of the limitations that local and potentially long-term weather that a hurricane will impose on imagery.  Much of the primary team is looking at other spectrums to try to peer through clouds in order to make observations of the ground, structures, and infrastructure.

Given our less constrained task, Robert and I have been considering other extreme events that avoid the problem of weather.  The two best candidates are tornadoes and tsunamis.  For tornadoes, the fronts are fast moving and do not typically linger for days.  For tsunamis, the triggering event is generally an earthquake and is not subject to weather events.  These classes of disasters suggest that we can deliver a product that focuses on the heart of the problem and is not subject to the broad number of ancillary problems associated with hurricanes.

We met this Nick at Dzyne and posed this alternative.  We will be searching for imagery in these areas using the available databases.

The onboarding process is proceeding.  I have been given access to a number of imaging databases and we have scheduled a number of training sessions with the different services.  We will have a large training meeting next Thursday.

As far as future schedule, the next government tag-up is scheduled for Monday (2/25) at 2:30p and Phase 2 Kickoff is scheduled for March 12-13.

I attended a meeting on Monday with Annijka at Descartes and Nick at Dzyne where they discussed the current Descartes platform and the Wide Area Motion Imaging (Wami) data available.  The primary Wami data originates from hurricane Florence which encompassed half of the eastern US seaboard.  To minimize the problem, the intent is to focus on an Area of Interest (AOI) around Wilmington, NC with four or five samples taken along the path of destruction in Wilmington and nearby inland areas.  Descartes is also looking at data originating from southeast Asia and San Juan due to the differences in infrastructure between different nations.  Data is expected to be ready for Phase 2 kickoff.

I have also begun the "onboarding" process with the Descartes Platform which involves gaining access to the platform and working through the instructions and tutorials for using the platform.  We have a bi-weekly tag-up meeting scheduled for tomorrow at 2pm where further introductions will be made.

In other news, I have researched integrating a Google calendar into slack which will allow us to establish a consistent teleconference.  This should allow any lab member to join the set teleconference appointment each week without the need to deal with messy point-to-point calls and last minute coordination.  Regular teleconferences will be established on Tuesday from 11a-12p for any paper meeting and on Thursday 2p-3p for the weekly lab meeting.

I think Robert and I will need to discuss what can be posted publicly due to the nature of this research, so this post reflects only part of the information shared in the GCA meeting held this week.

Phase 2 kickoff will scheduled for March 12 or 13th.  At this point meetings will become bi-weekly rather than monthly.  The proposed schedule for meetings is every other Monday at the same time as the monthly tag-ups.

Phase 1 has been pulling data from Digital Globe and Descartes Labs.  These data sets include data covering typhoon and hurricane affected areas.  Some of these data sets contain significant cloud cover.

There is consideration of using radargrammetry via Radar Sat data as a low resolution filter so that only optical data from areas of interest will need to be processed.