The flooding in Houston associated hurricane Harvey was primarily due to release from the Addicks and Barker reservoirs which flooded the Buffalo Bayou river.
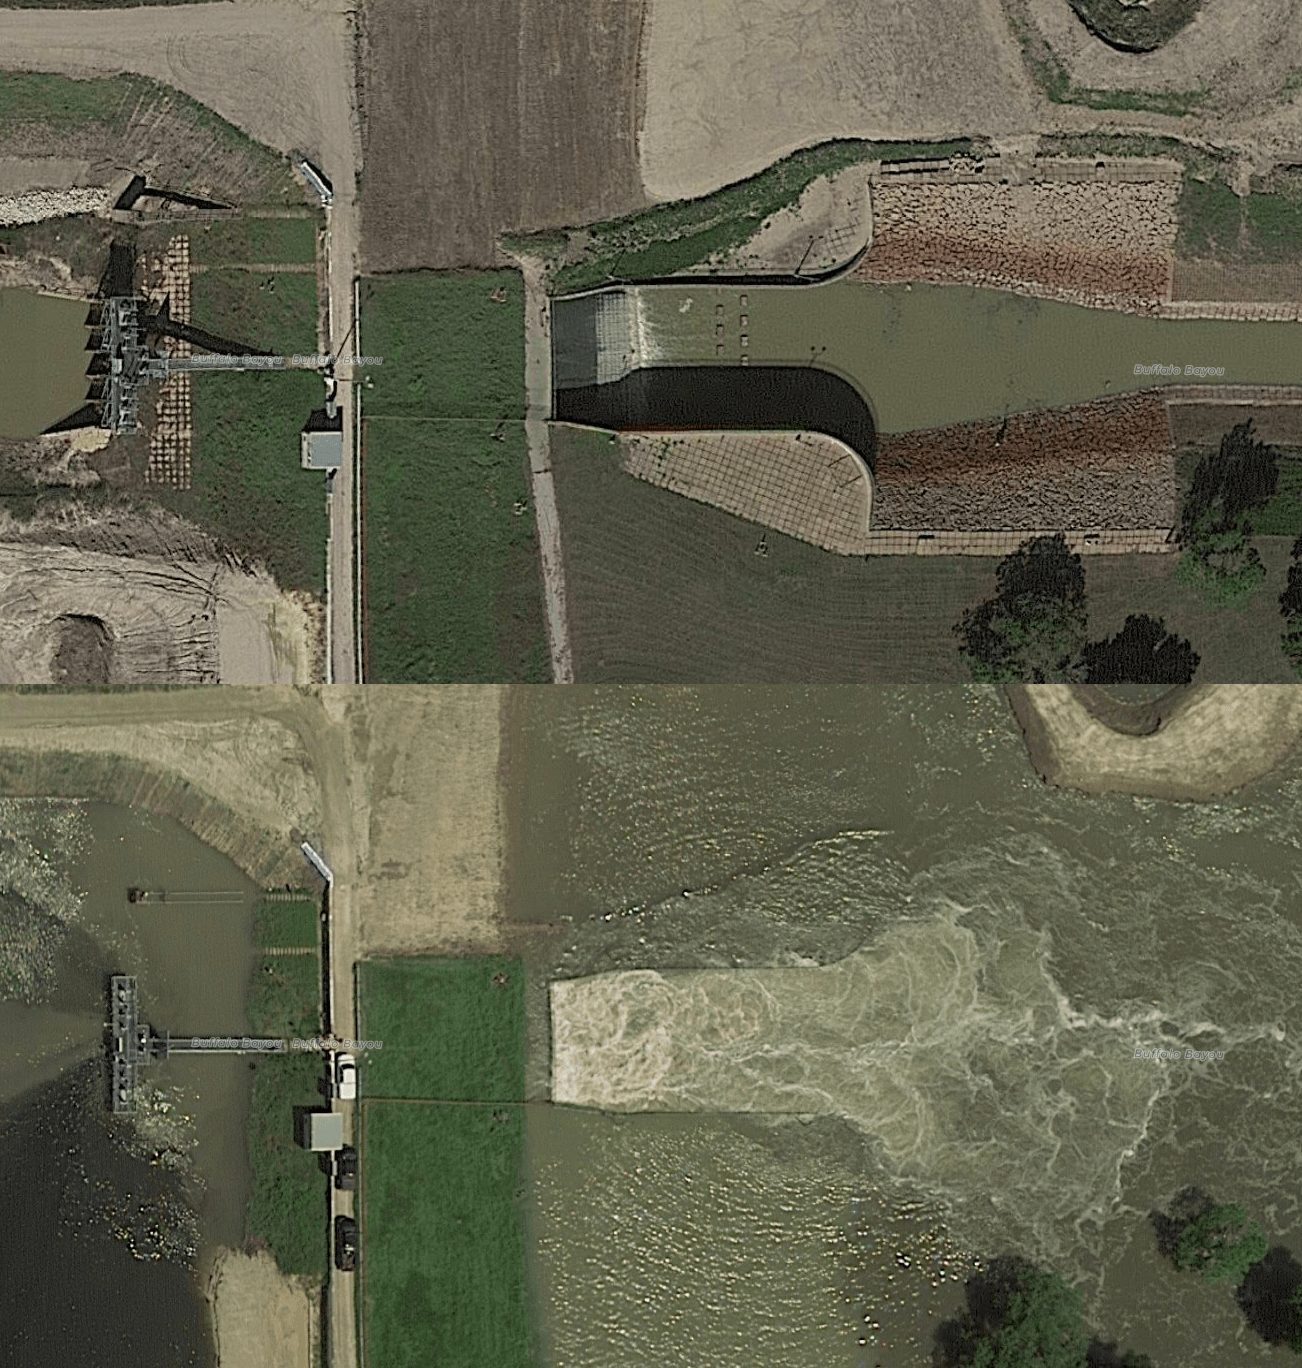
The dramatic change in water level in Buffalo Bayou is best illustrated by photos taken above the Barker Reservoir flood control station before and immediately after the hurricane struck.
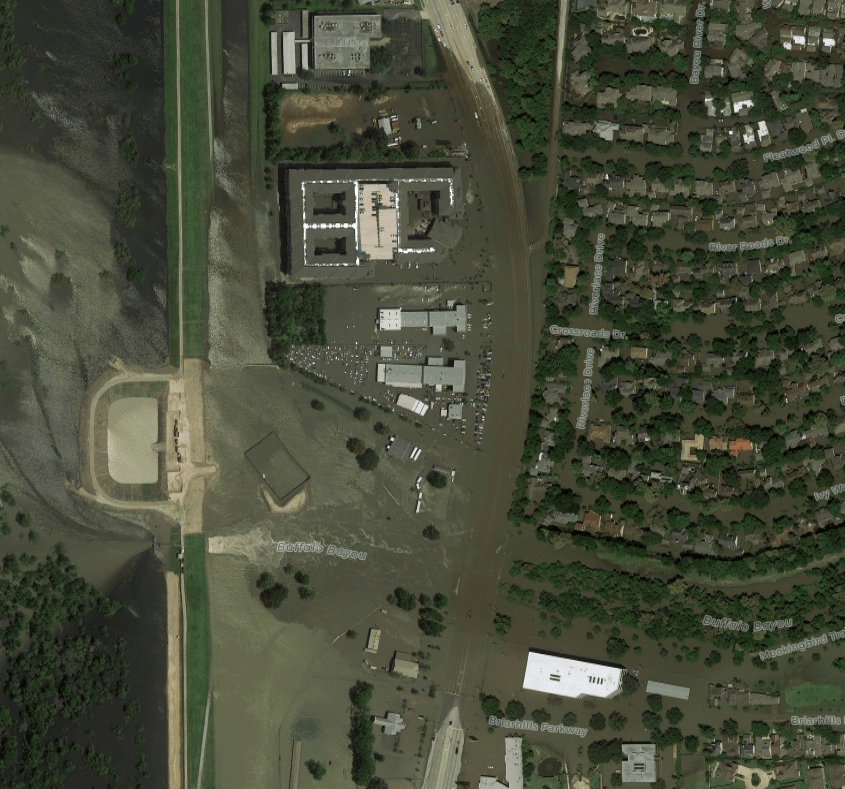
Our project is driven by the need to determine the water depth over roadways. The impact of the Barker flood release on the local infrastructure is illustrated by the flooding over Hwy 6 which is adjacent to the Barker flood control station and passes over Buffalo Bayou.
Our problem specifically involves developing a metric that we can use to determine whether a road is passable or not. While a quantifiable metric would be most desirable, we expect quantification to be difficult. We have considered a metric involving a set of classes: dry, wet, flooded; however, these are still difficult classifications to develop from purely optical data.
One idea that we have kicked around is that we can see road markers in relatively shallow water and as the water depth increases, the opacity of the water rapidly increases due to the turbidity of flood waters; however, our intuition suggests that this approach will encounter difficulties because as water settles, the sediments will ultimately obscure road markings regardless of the depth. The following pictures are close-ups of the Hwy 6 area around Buffalo Bayou.
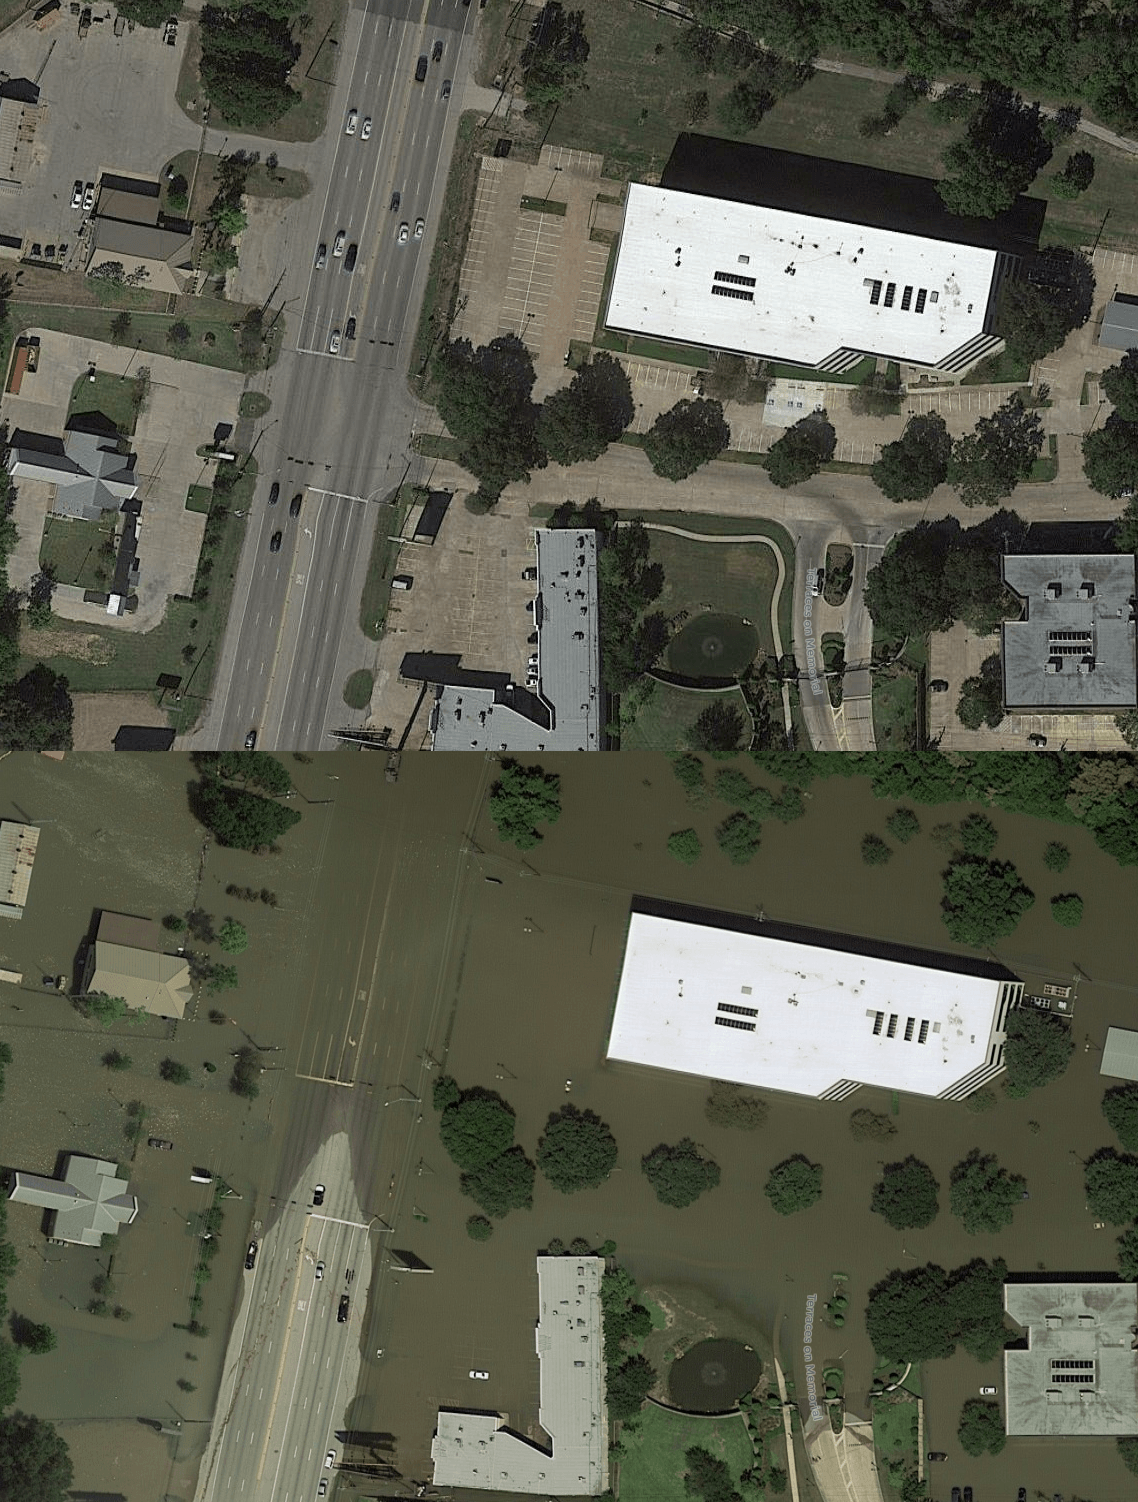
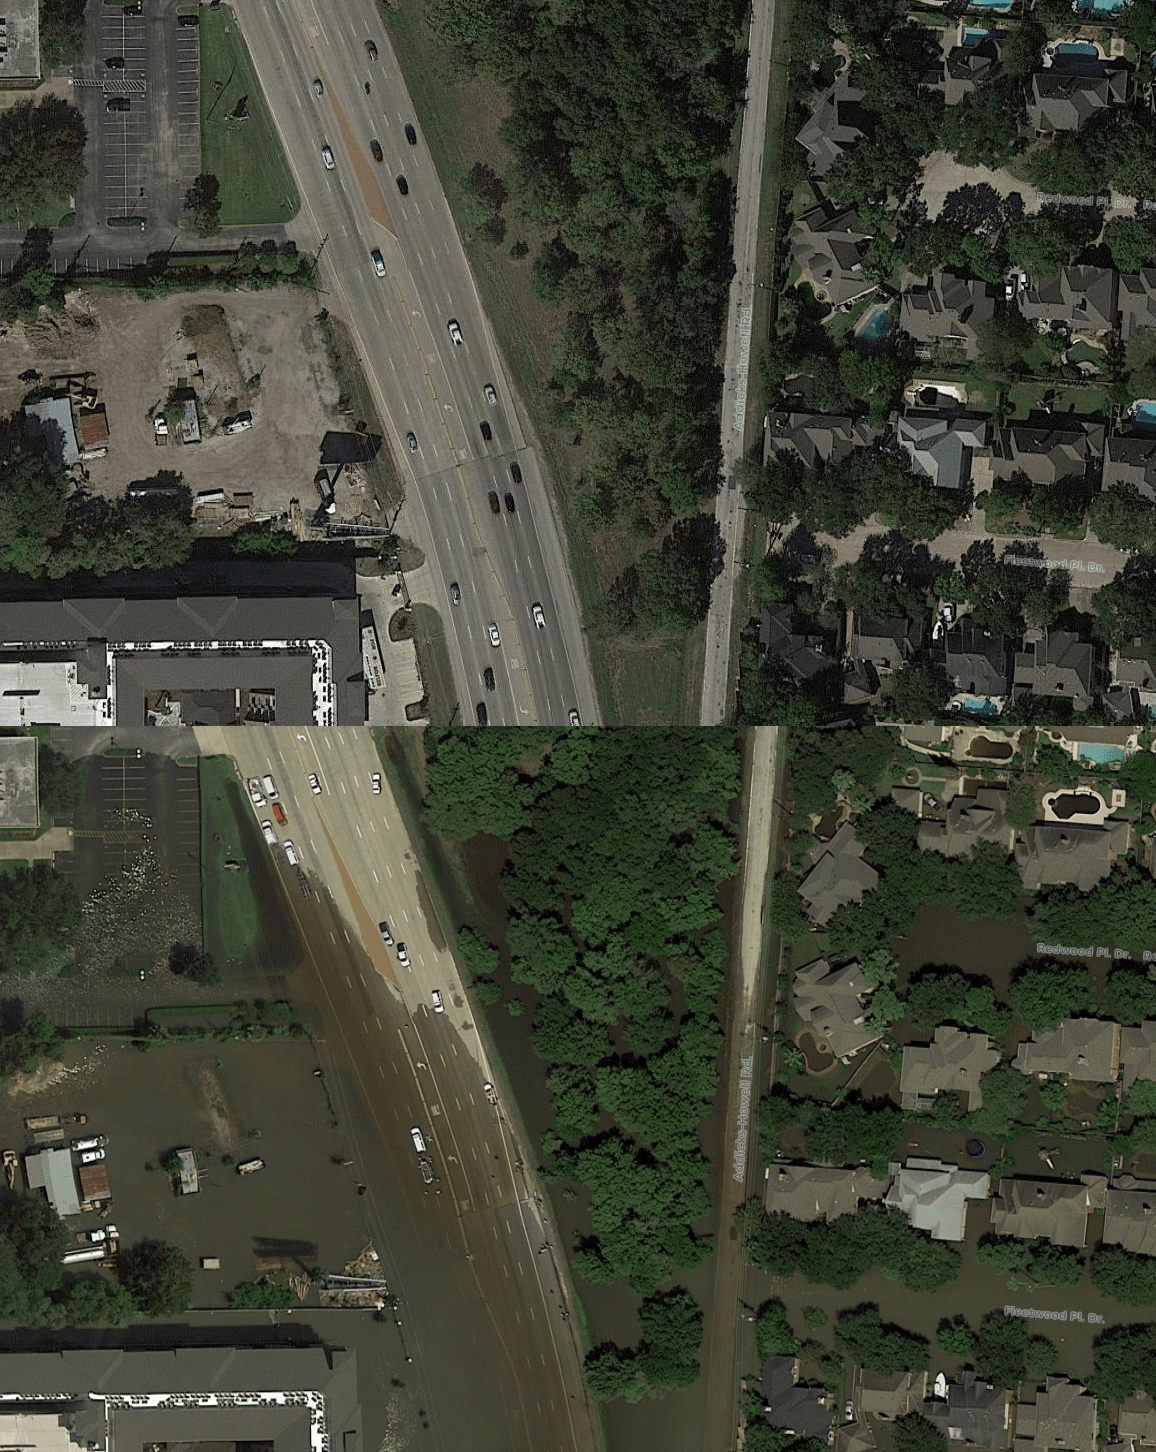
We can clearly see where the water line is in the above pictures, and we believe that this is information that we can train on with a human in the loop.
When Nick found out that my background is computer simulation, he proposed that we use elevation models (DEM or LIDAR data) to simulate water movement in an area. I was not too receptive to the idea because water simulations can be really complex problems dependent on Computational Fluid Dynamics (CFD) which may require massive computing resources. The important consideration from this discussion though was the potential inclusion of DEM data into our training regime.
We believe that we can incorporate the elevation data with optical data to determine water depth based on the assumption that the "localized sea level" is roughly constant. If we locate the water line in a number of locations, we can use that elevation to define the localized sea level and can then determine depth of features throughout the local area.
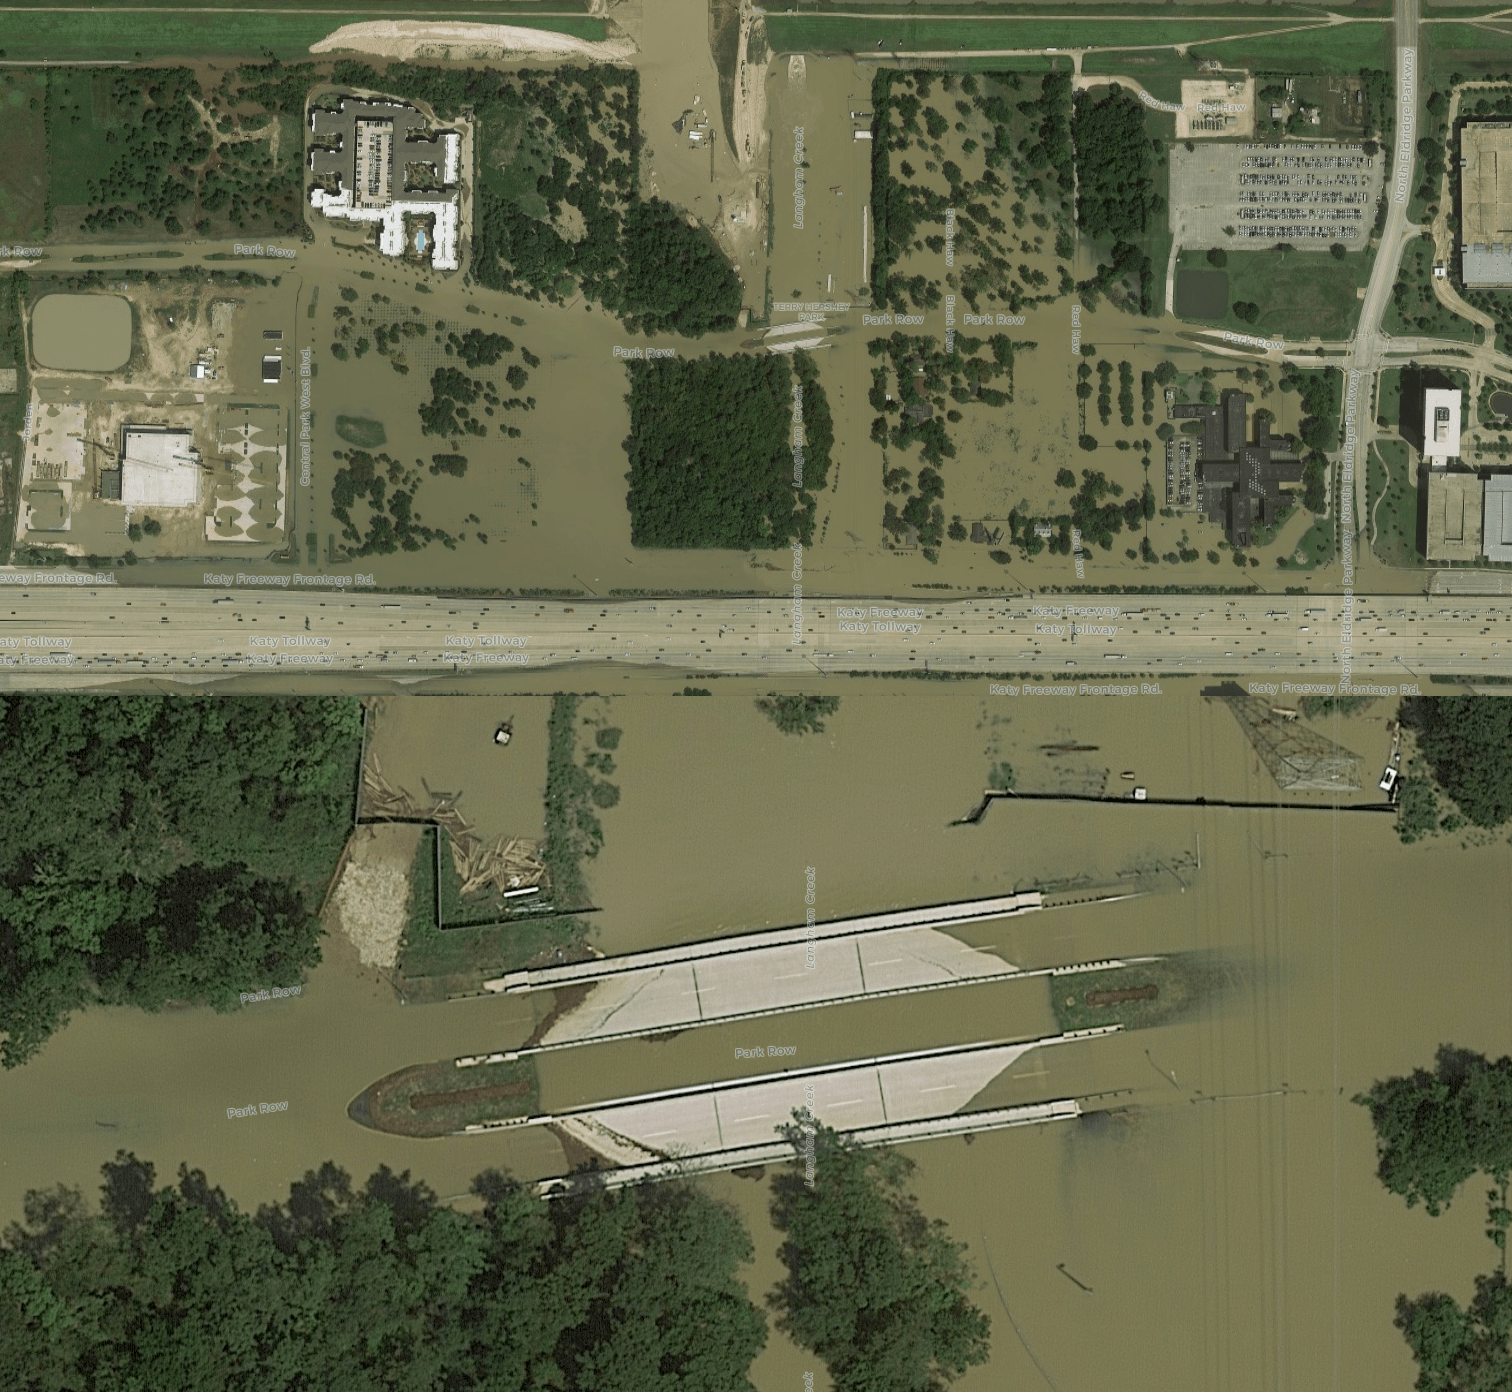
Some infrastructure may be of particular interest. For example, the central span of bridges are level for structural reasons. The following image shows the Park Row bridge over the Addicks reservoir outlet.