Last experiment picked a particular lambda of yoke-tsne, and in this experiment, we pick up several lambda trying to see how lambda affect yoke-tsne.
As last experiment, we split Stanford Cars dataset in dataset A(random 98 categories) and dataset B(resting 98 categories). And, train Resnet-50 by N-pair loss on A, and get embedding points of those data in A. Second, train Resnet-50 by N-pair loss on dataset B, and using this trained model to find embedding points of data in dataset A. Finally, compare those two embedding effect by yoke-tsne.
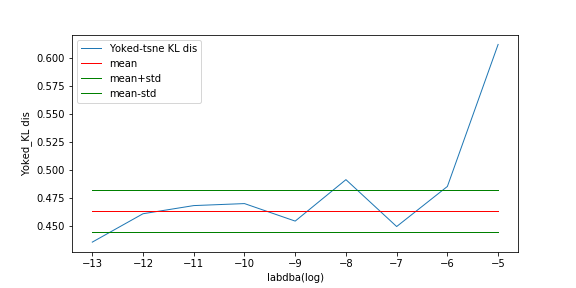
In this measurement, with lambda change, we record the ratio between KL distance in yoke t-sne and KL distance in original t-sne, and record the L2 distance.
The result is as following:
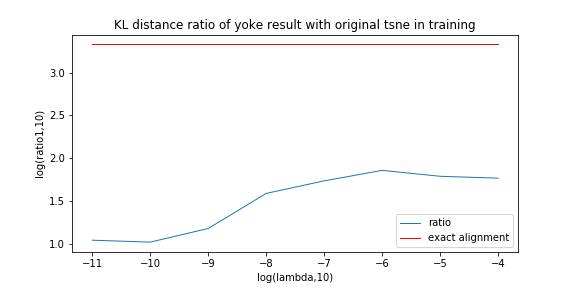
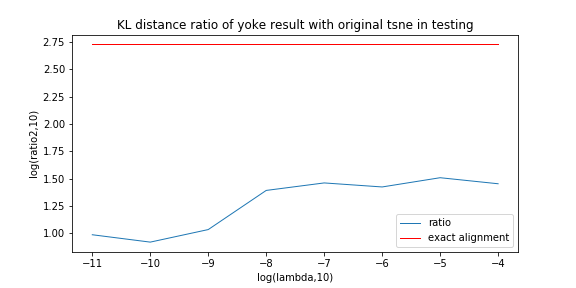

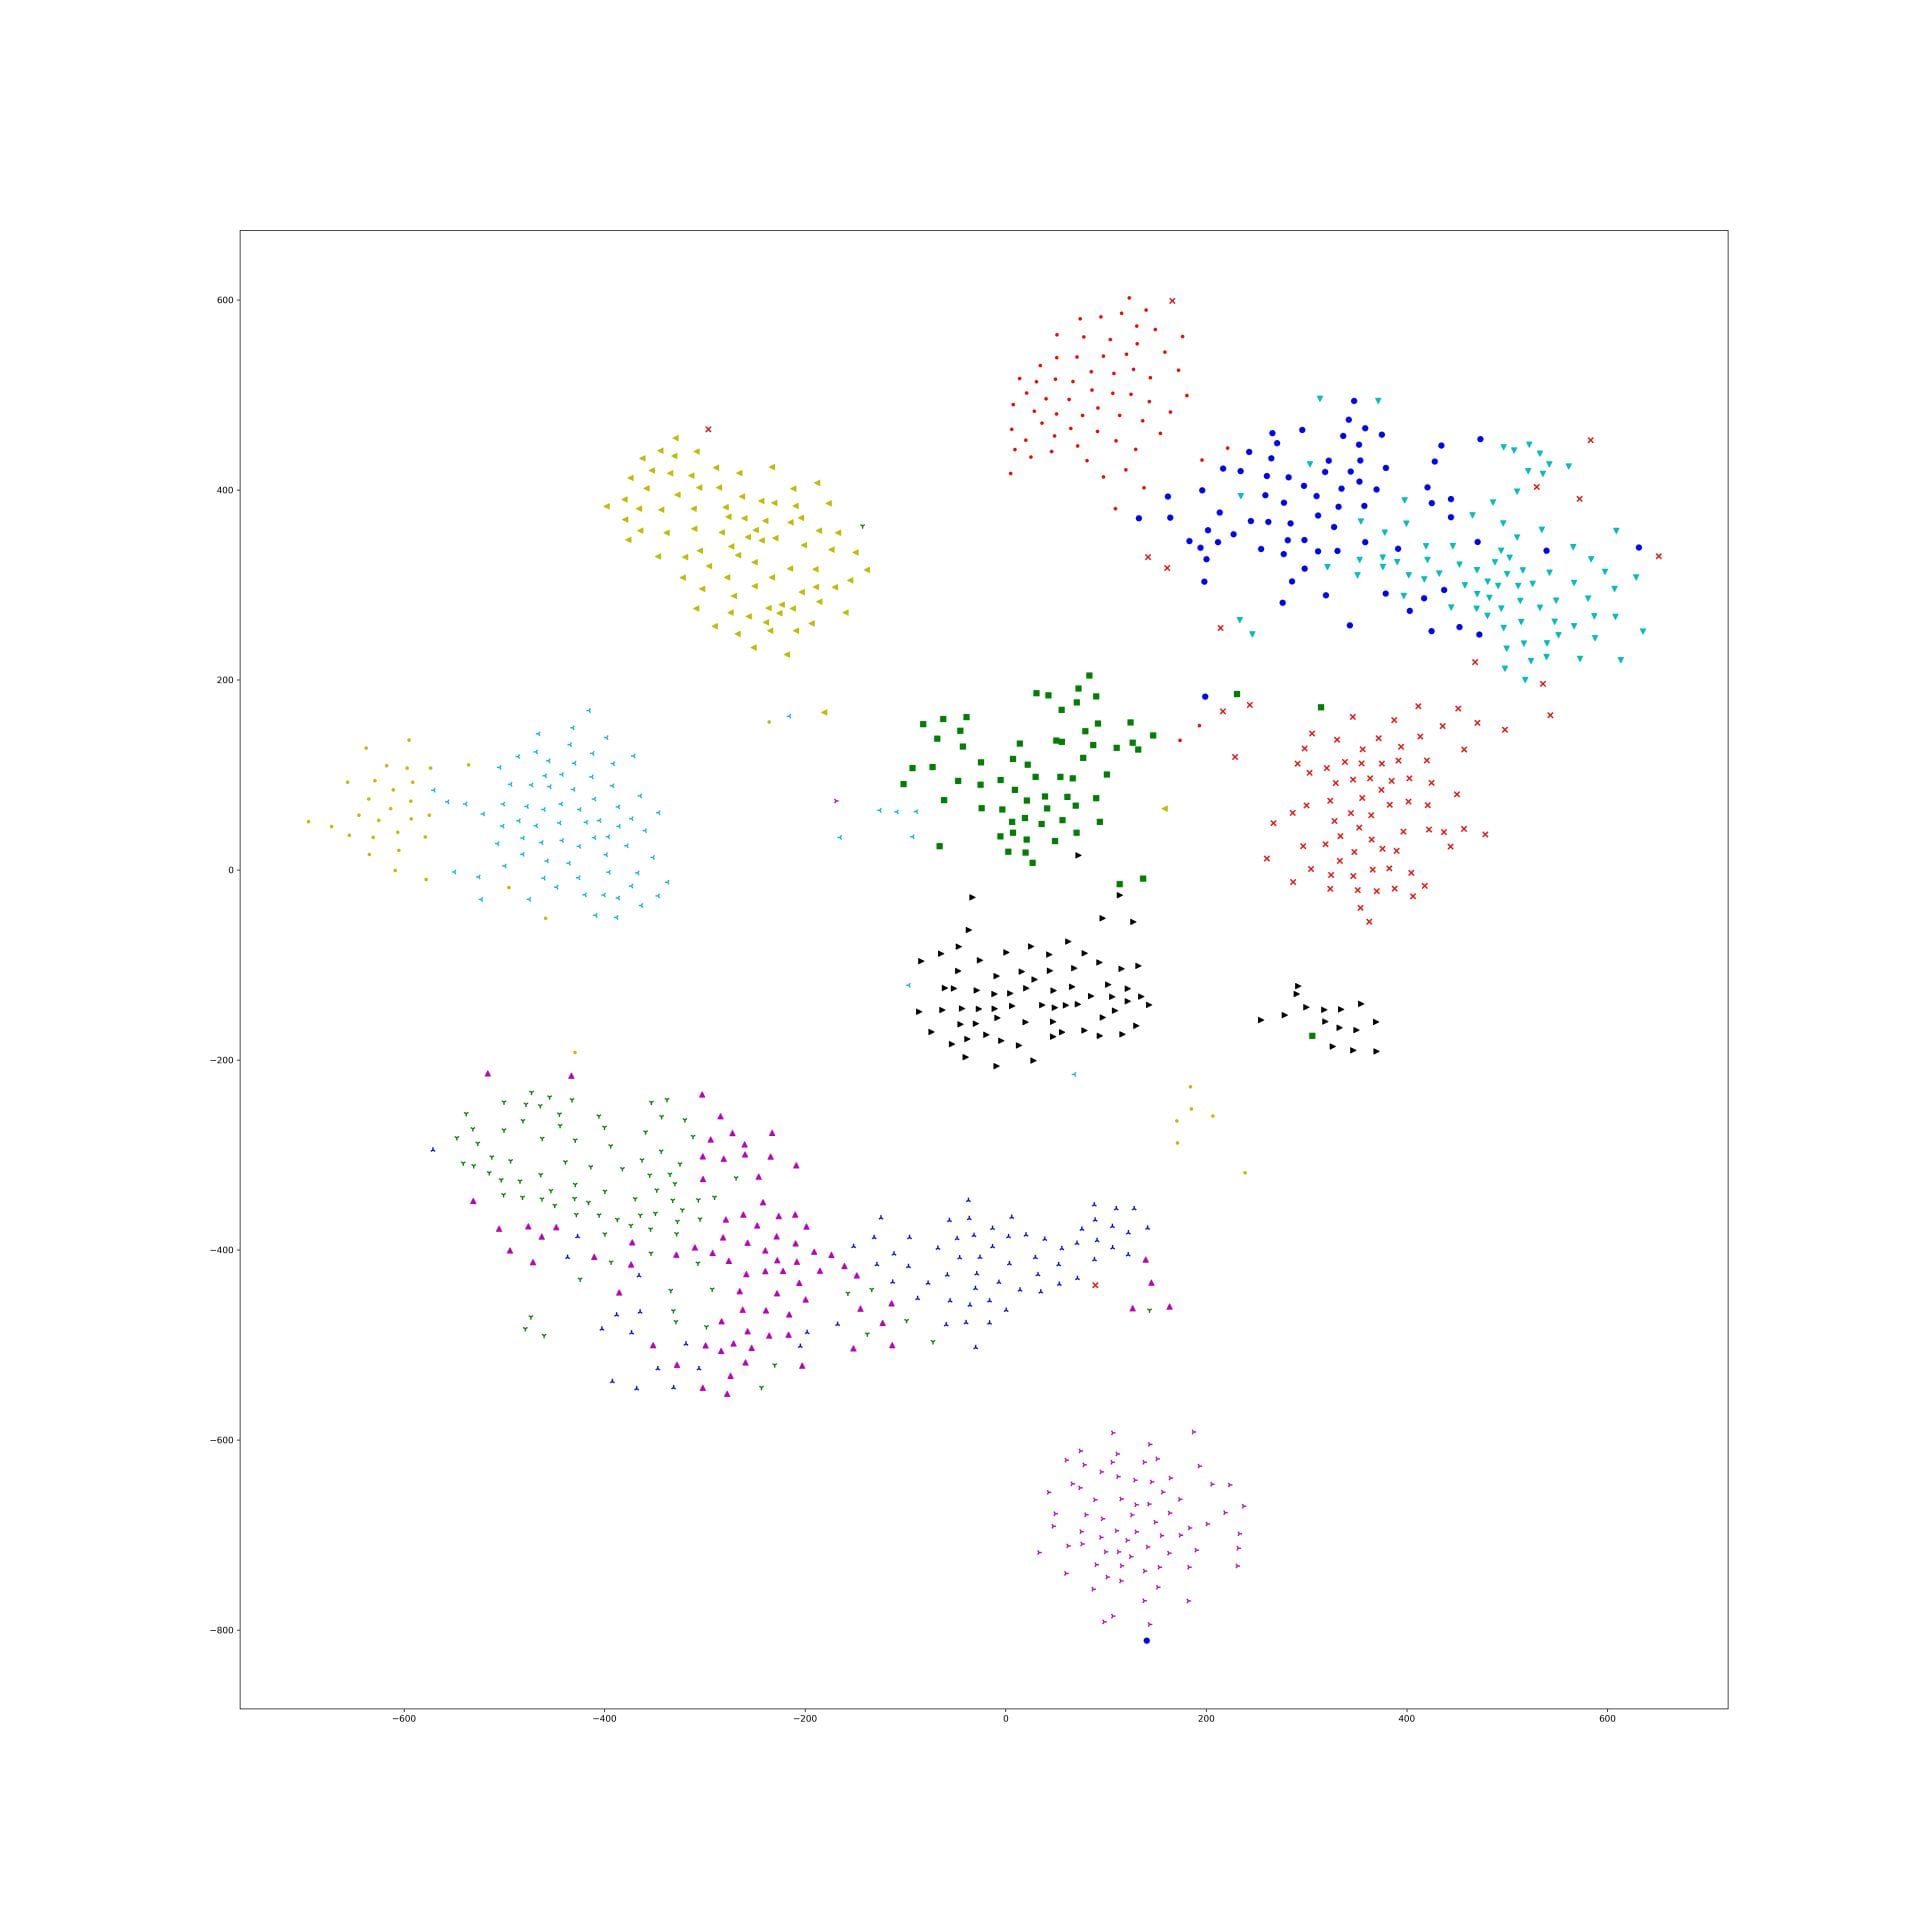
We can see the KL distance ratio get an immediately increase when lambda is 1e-9. The yoke tsne result figure show that when lambda is 1e-8, the two result look like perfect aligned.

And, when lambda was downed to 1e-11, the yoke tsne seems no effect.

And, 1e-9 and 1e-10 works well, the training tsne get some local relation(between clusters) of testing one and keep the cluster inside relation:
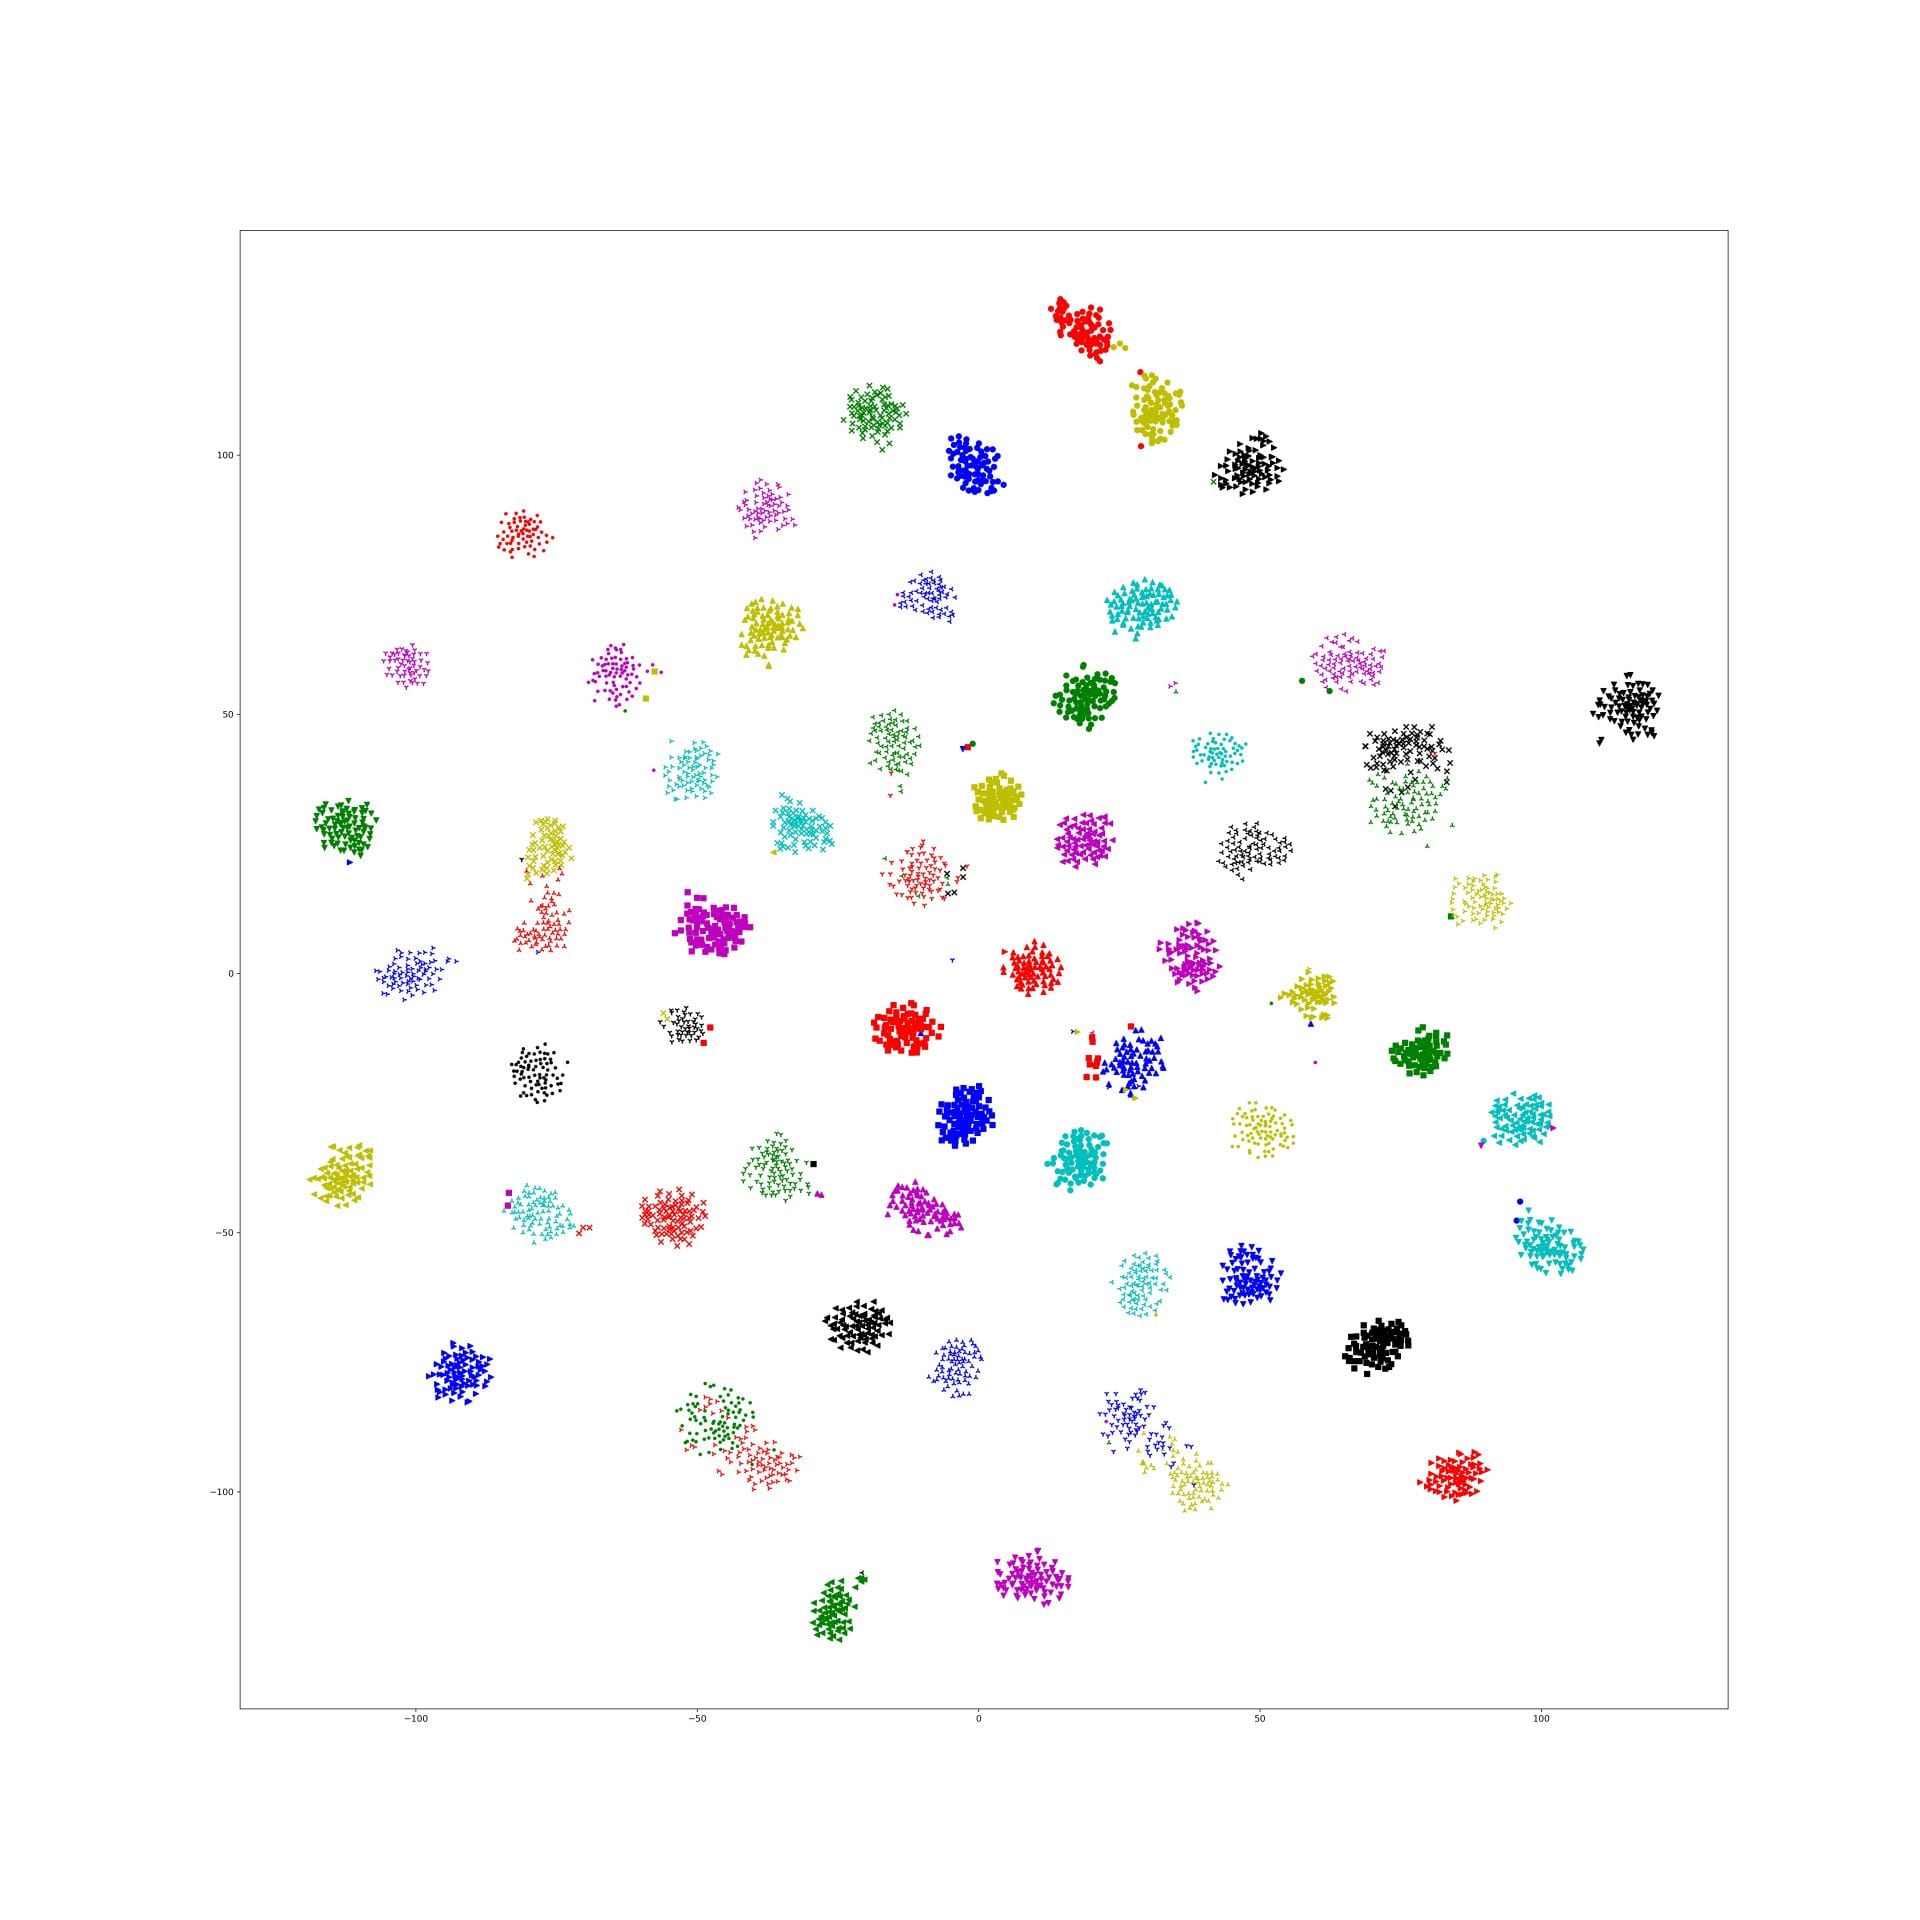
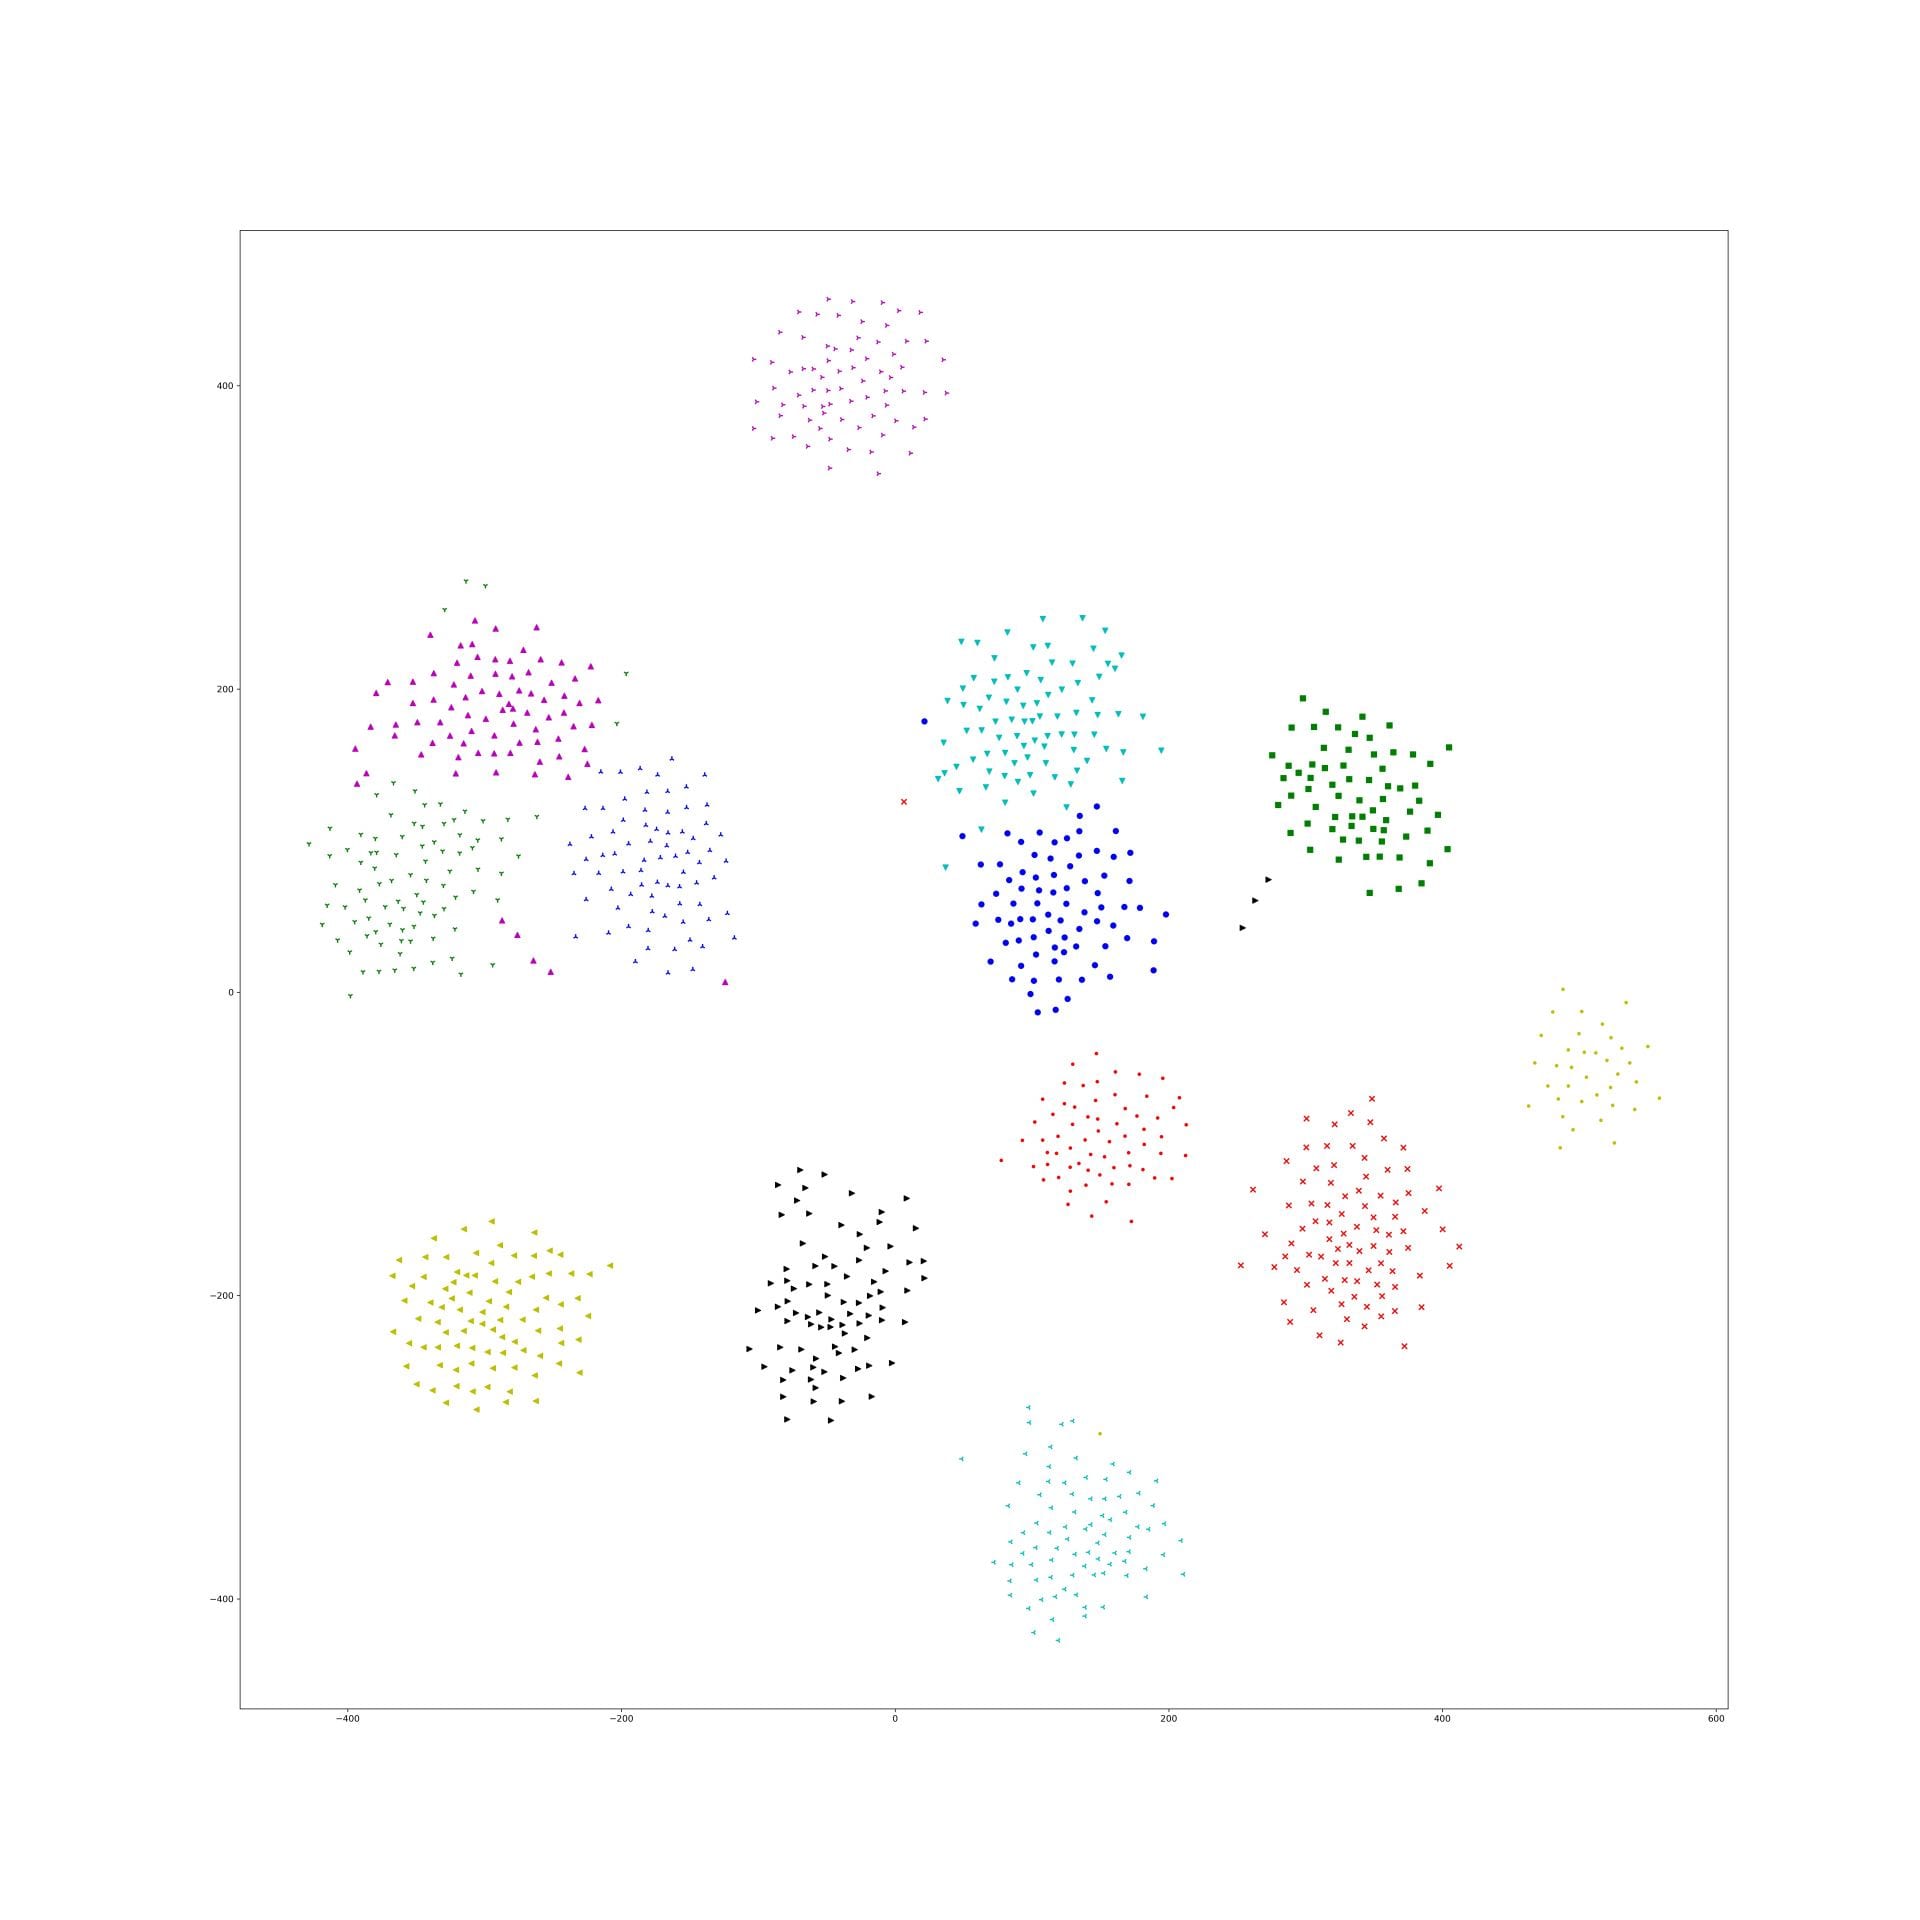
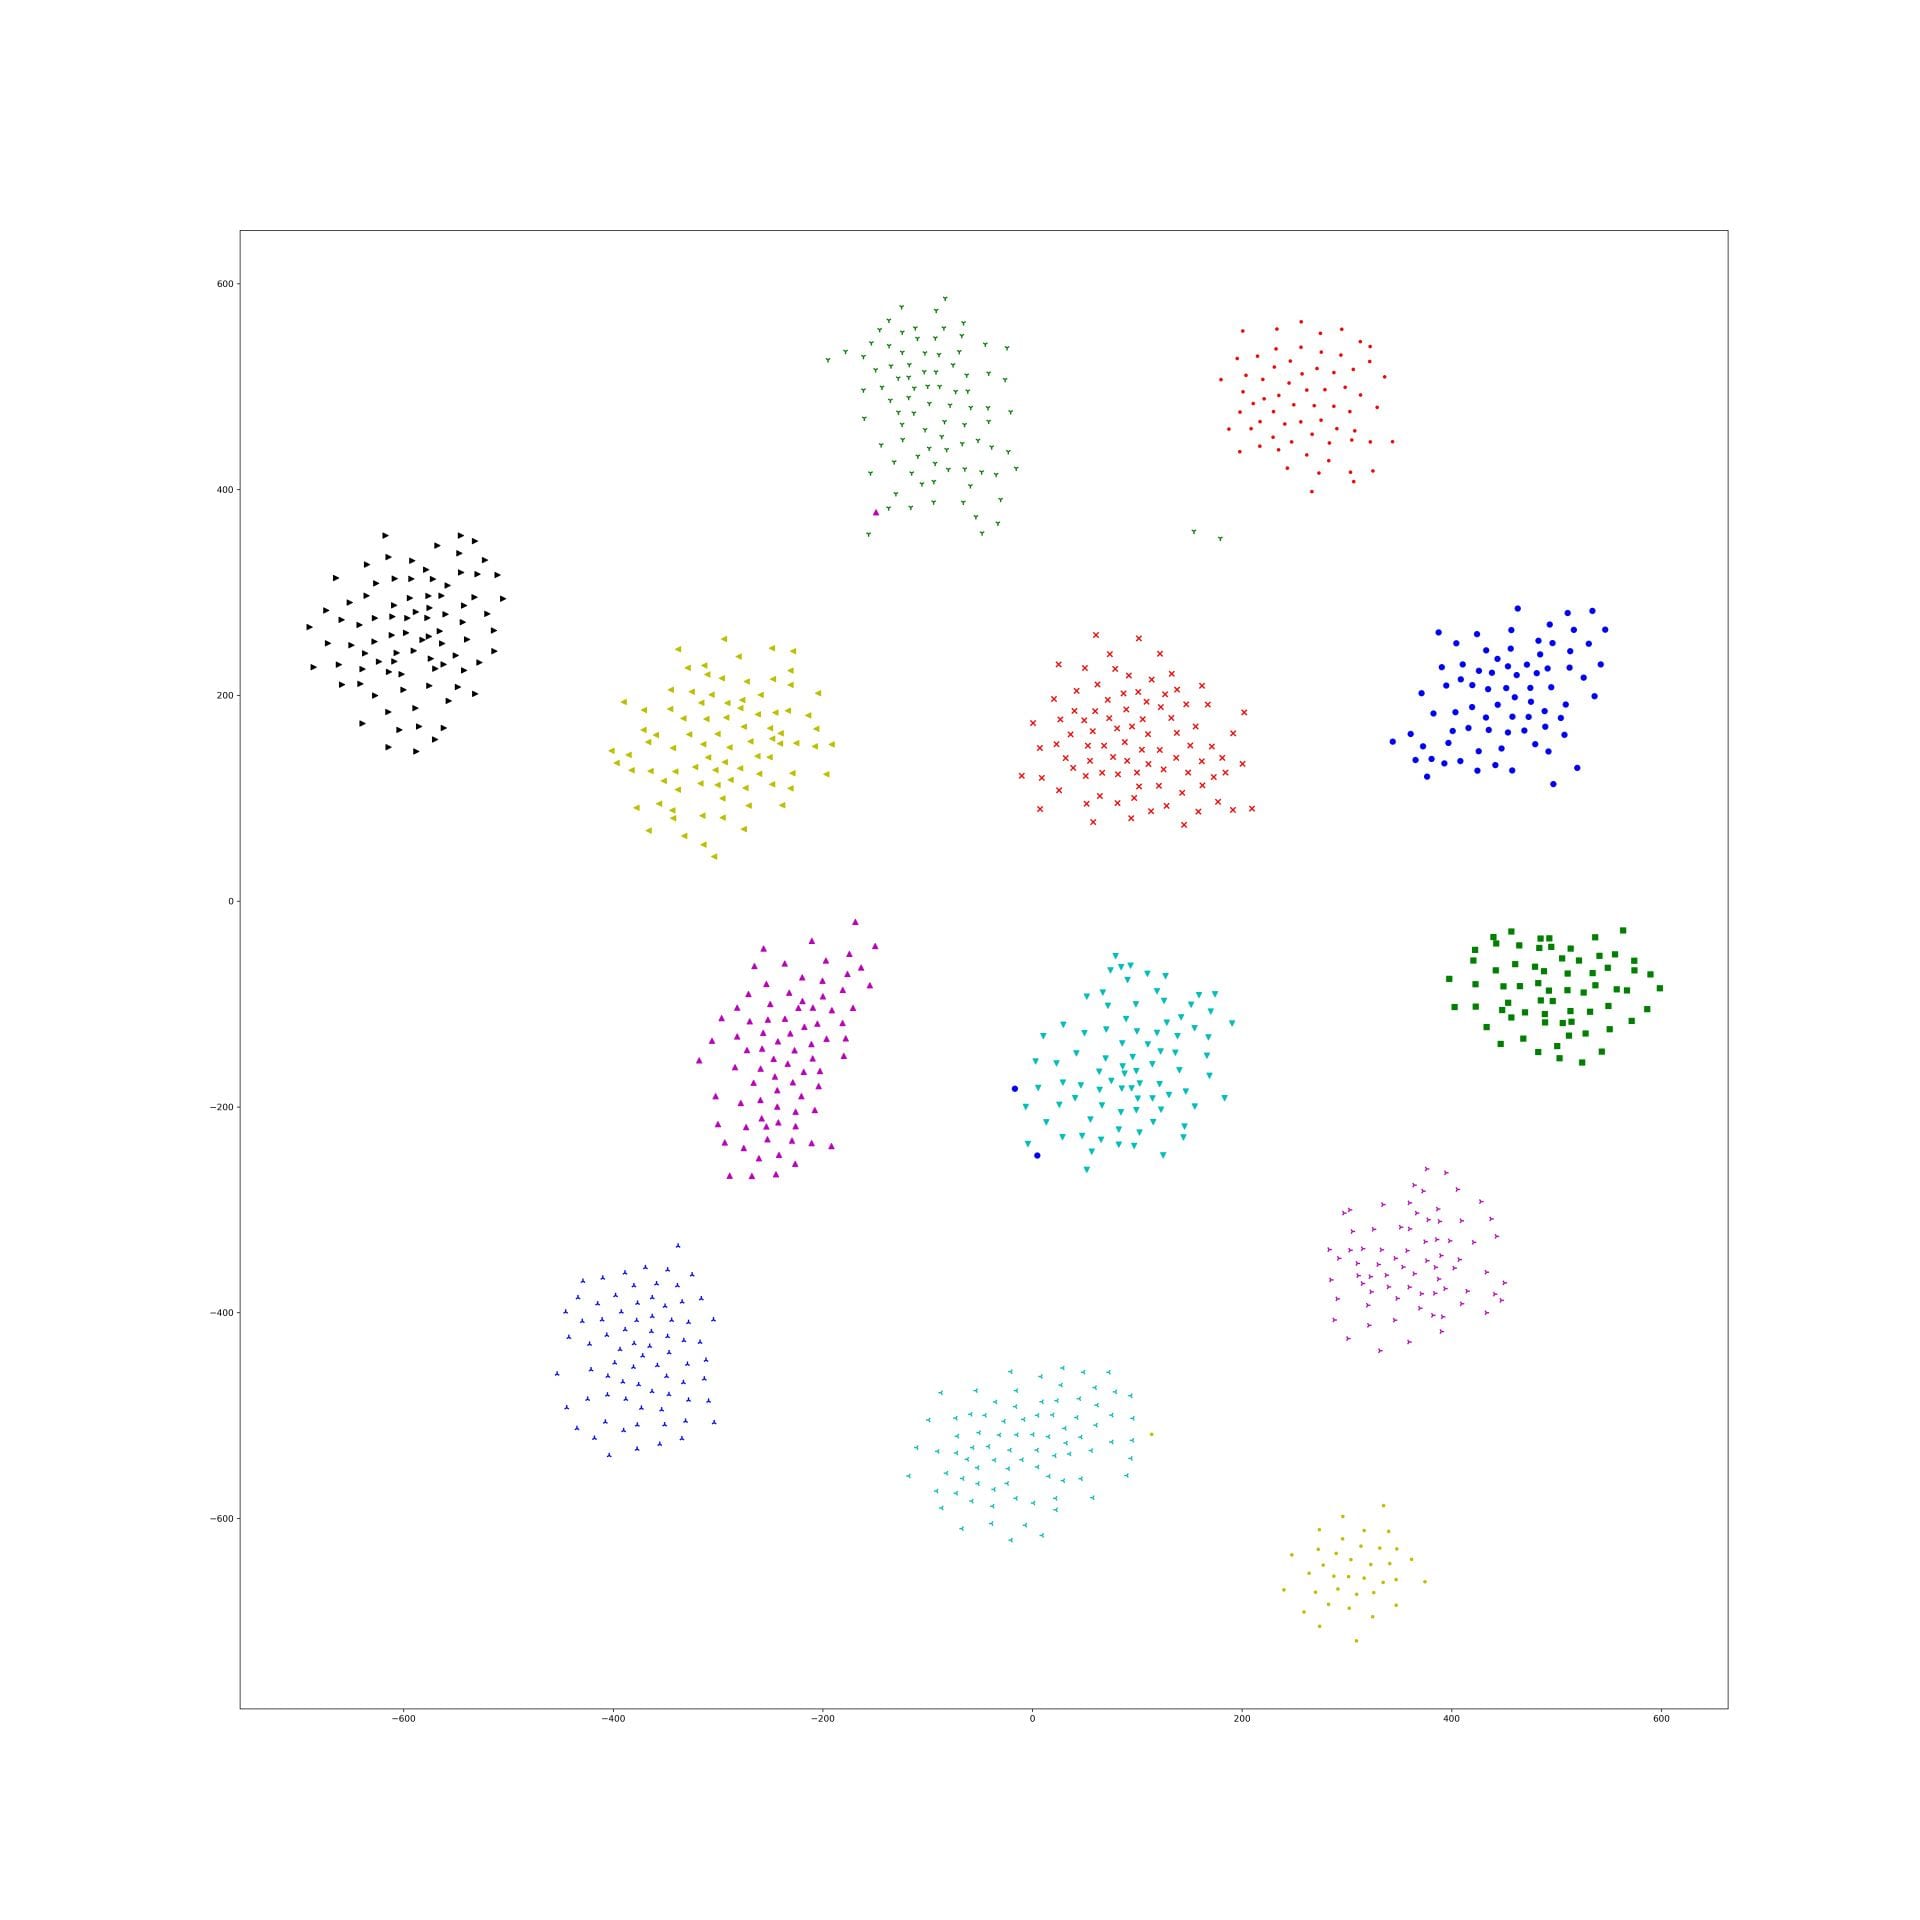
Here is the original tsne:
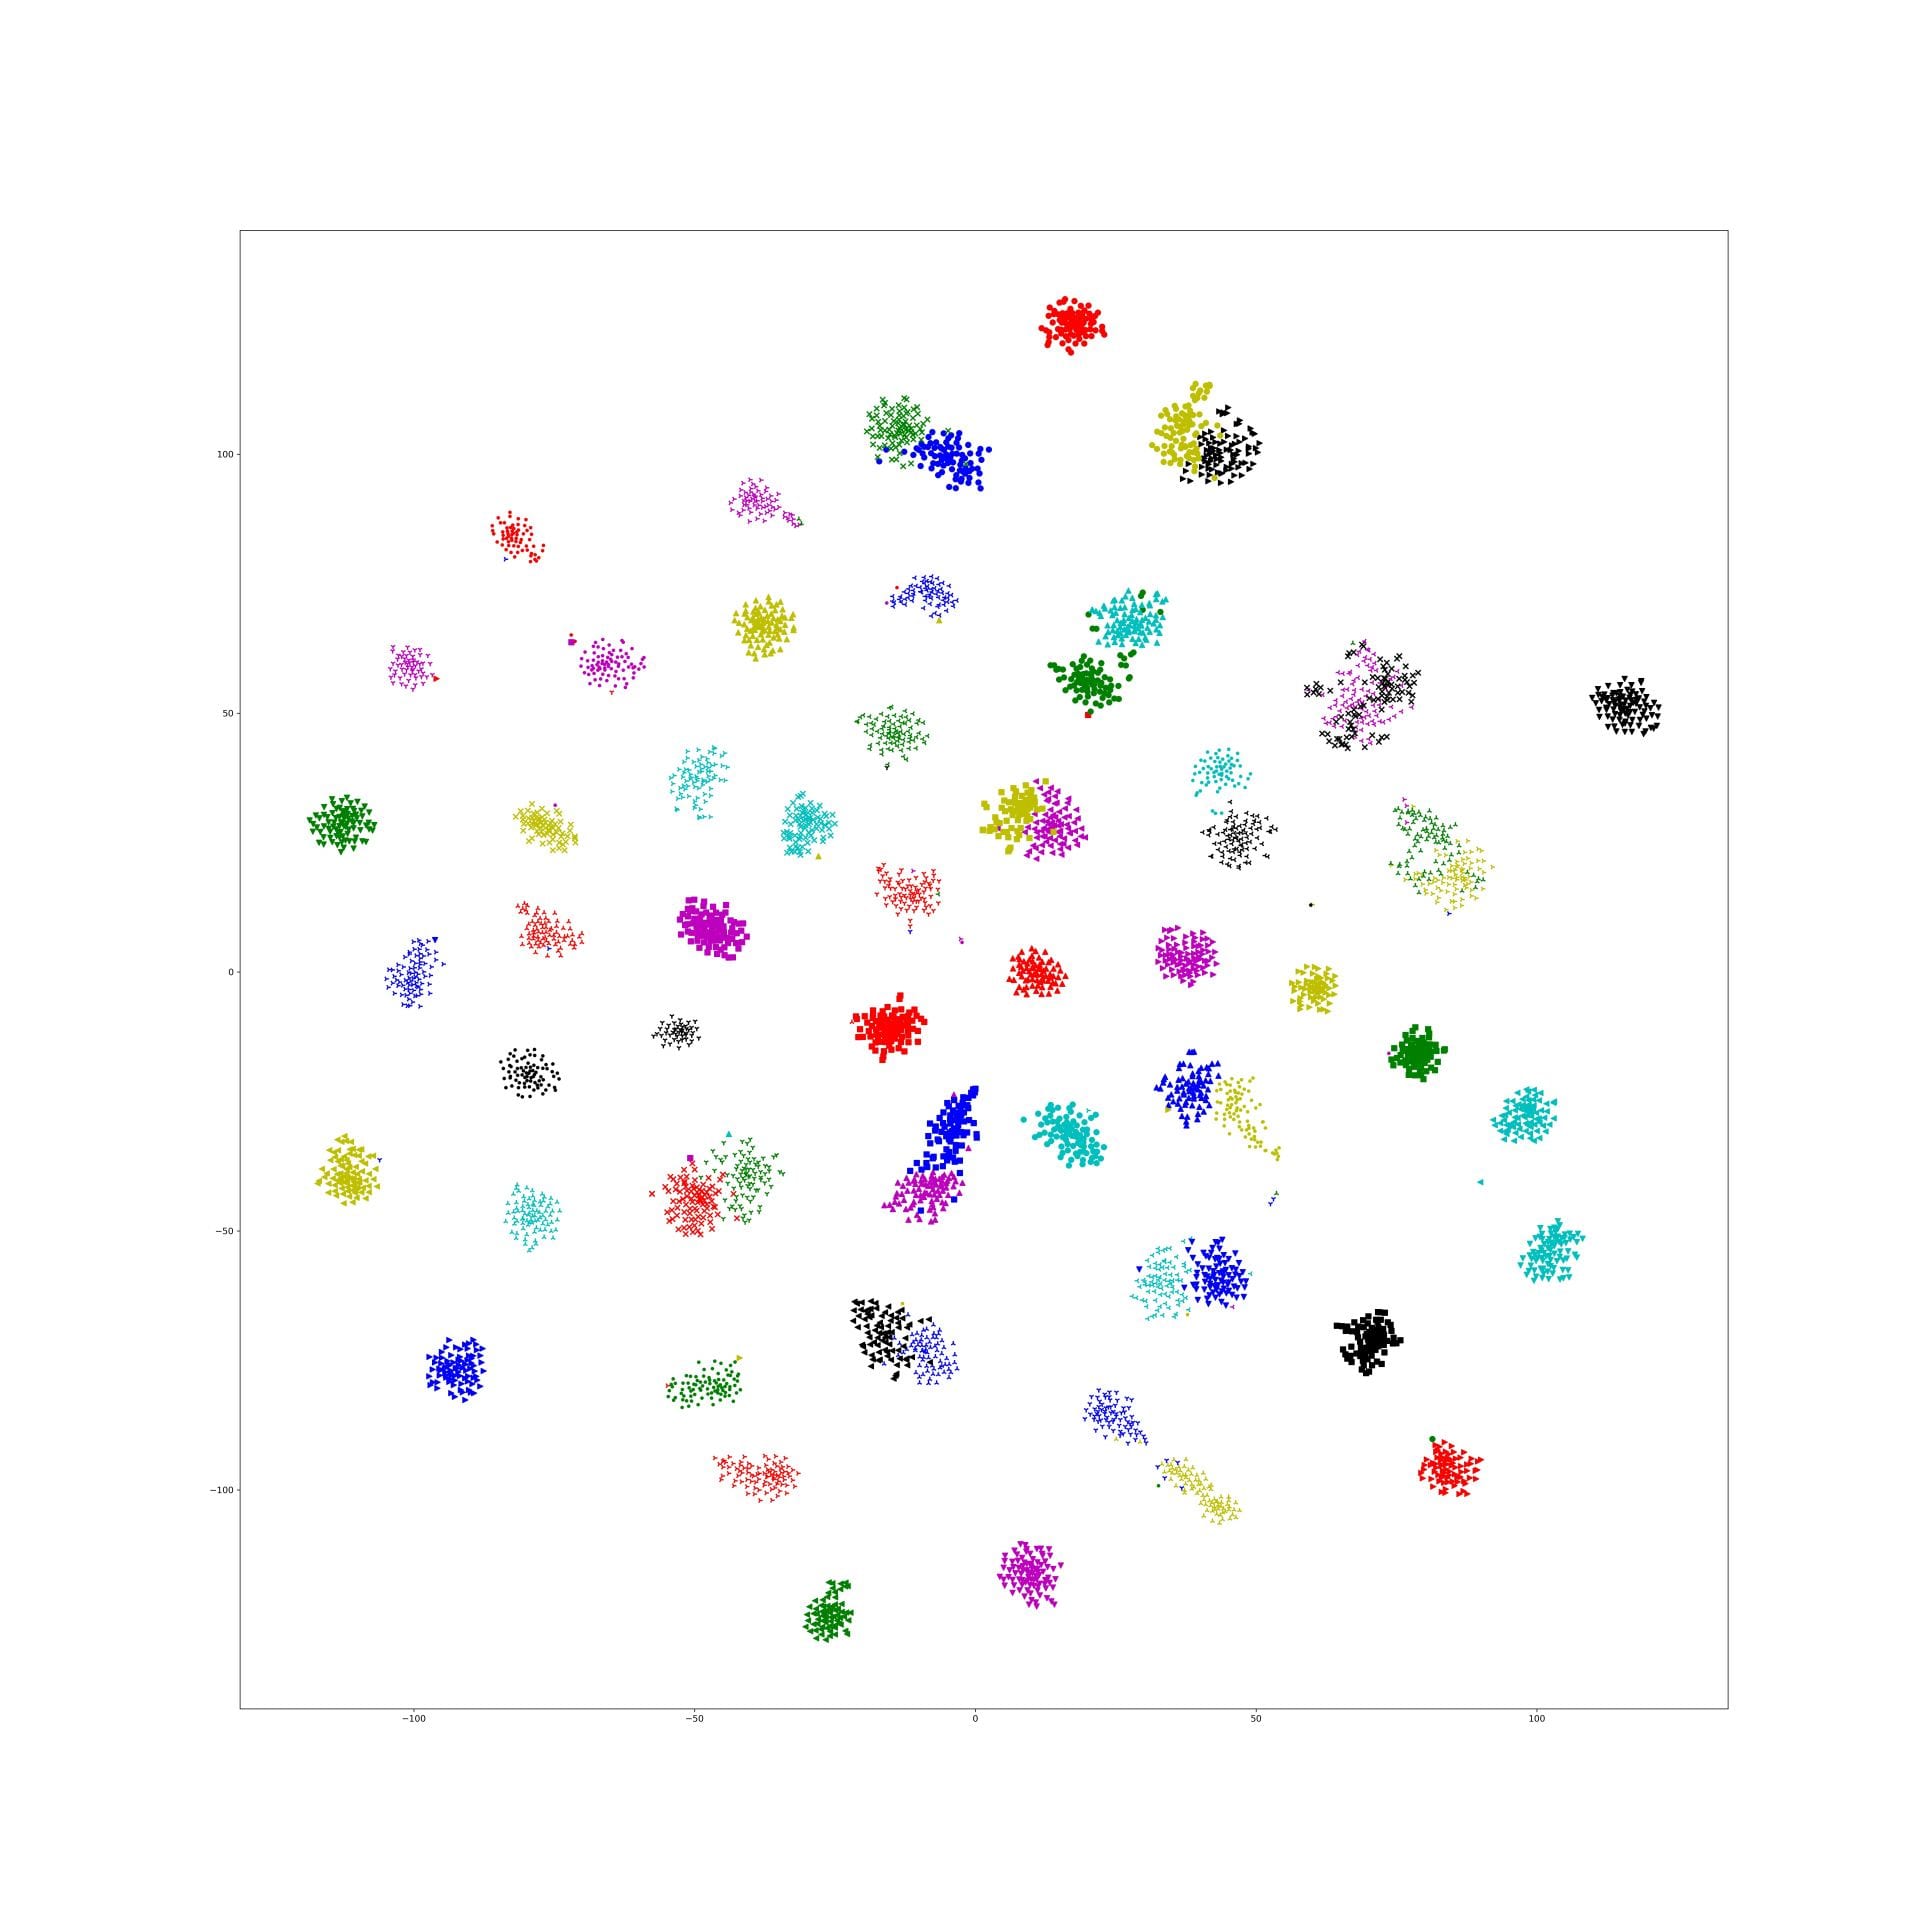
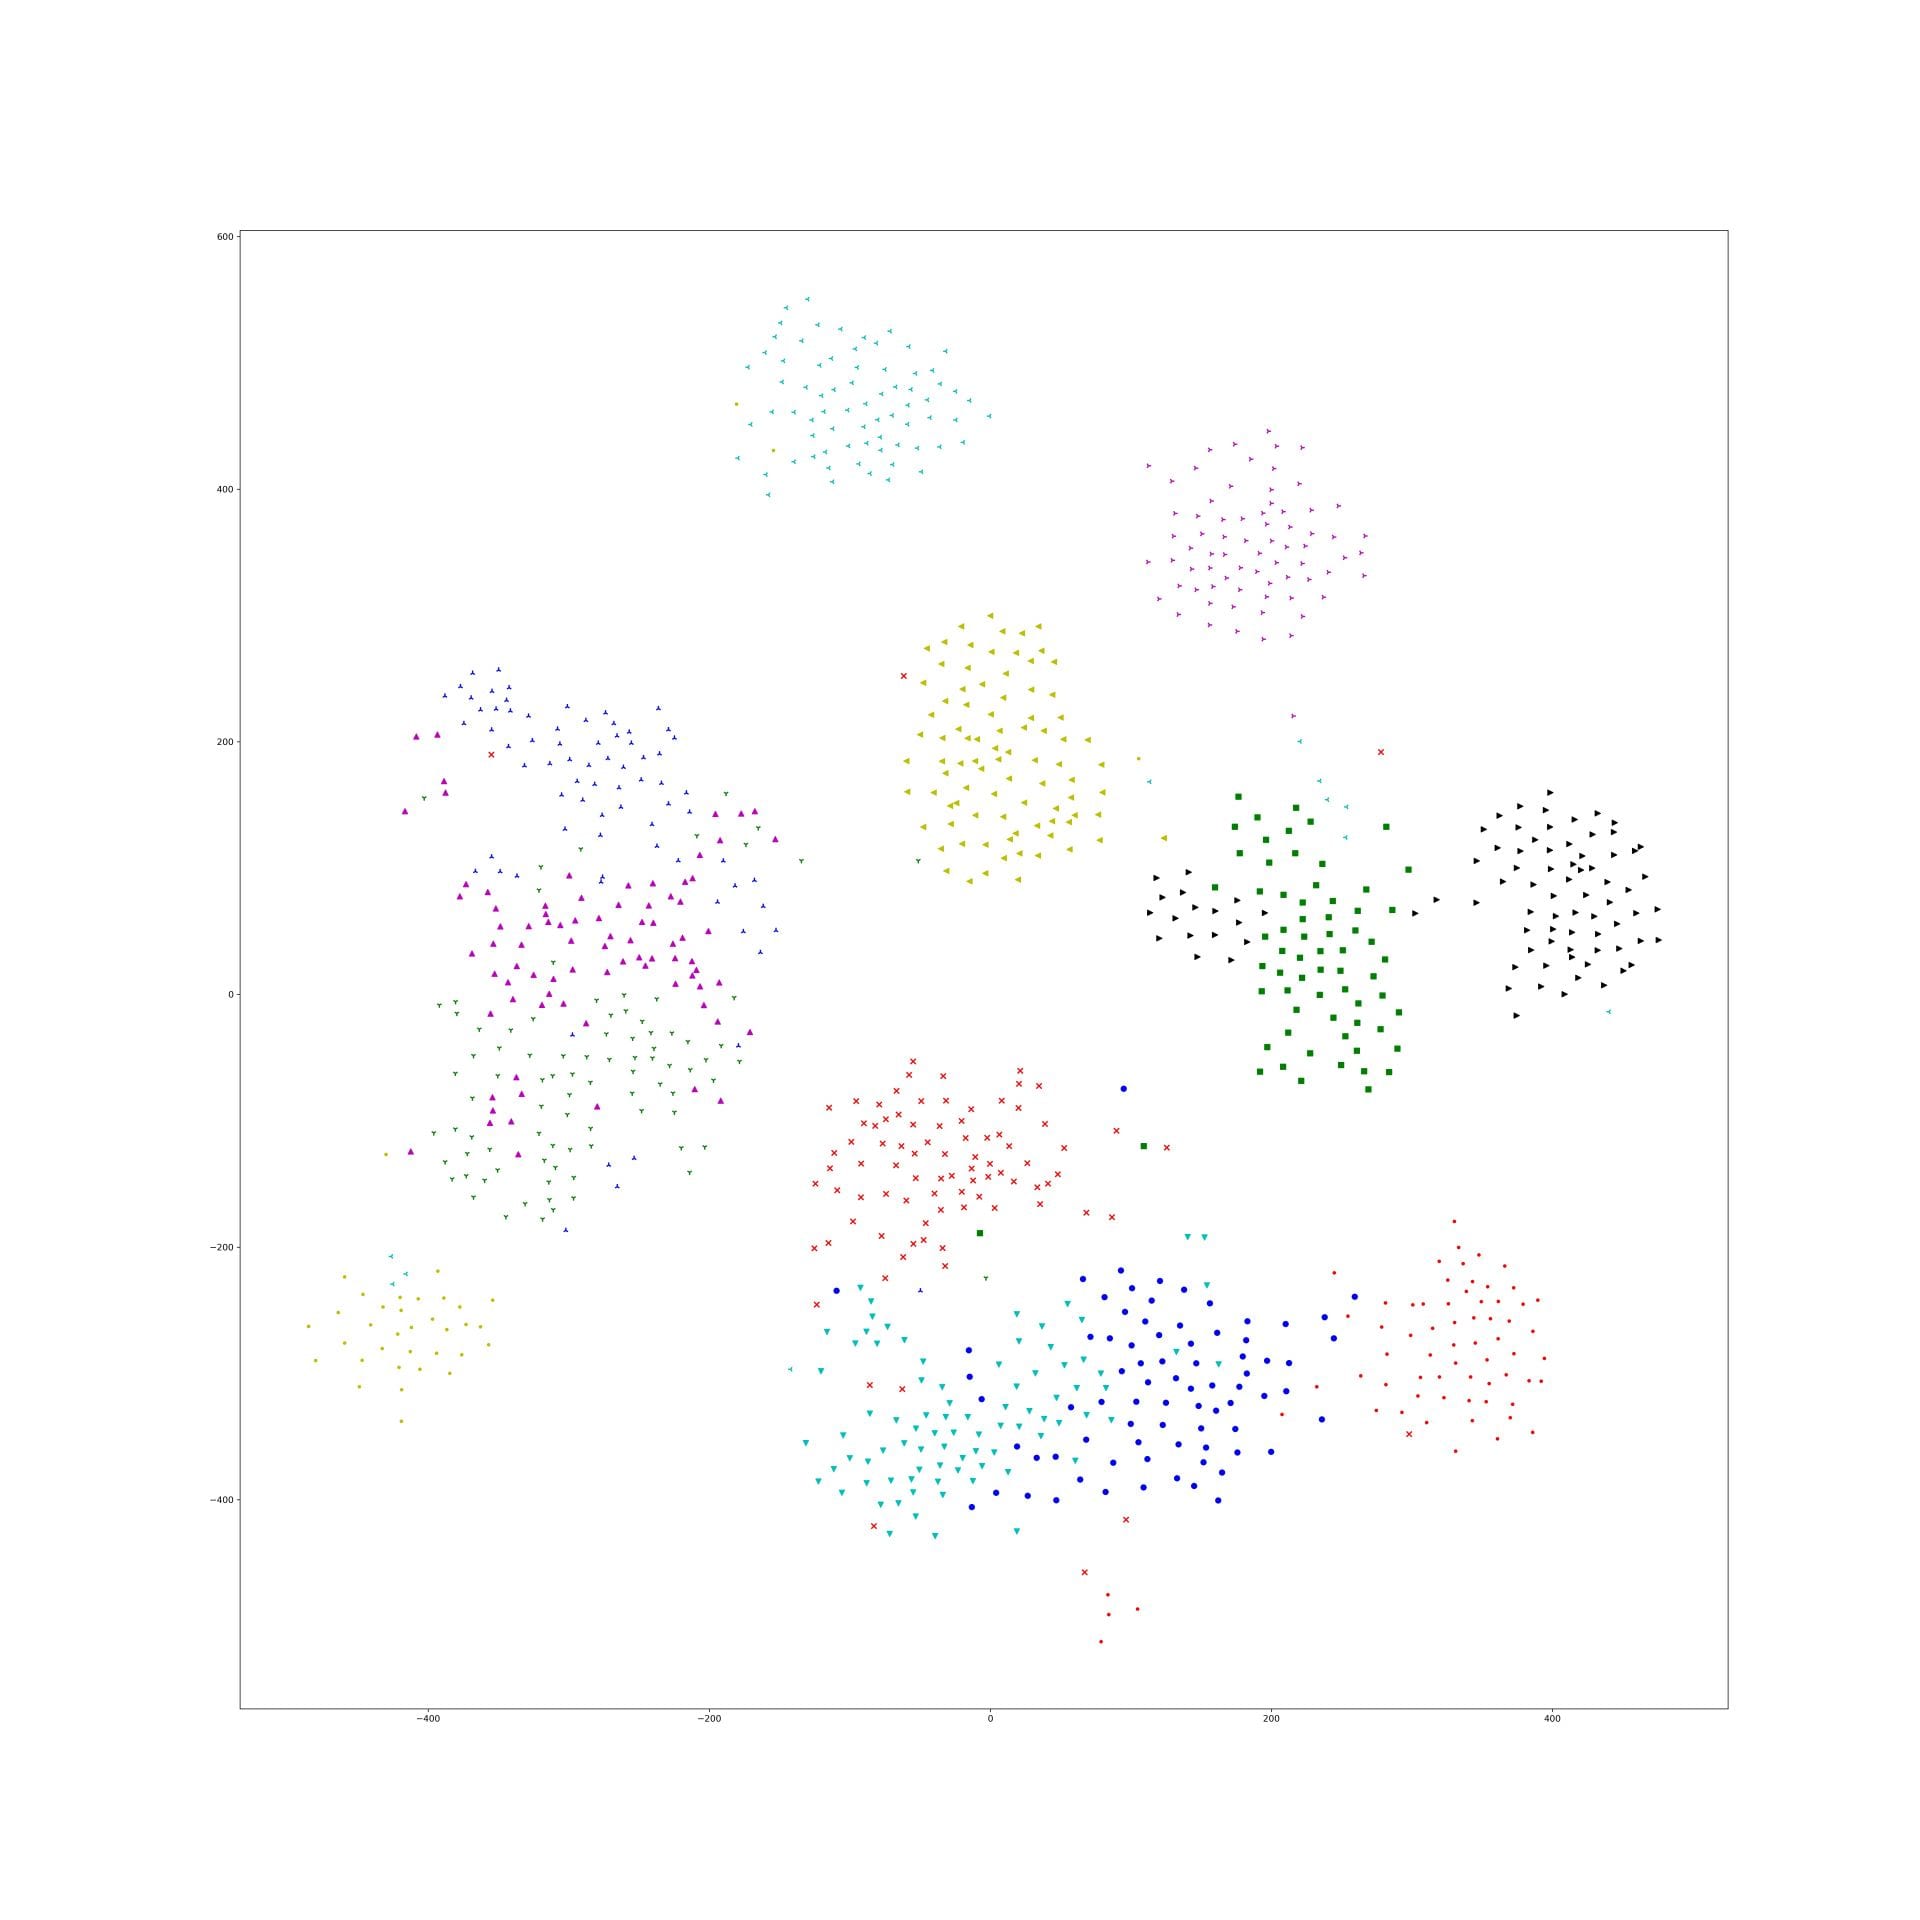
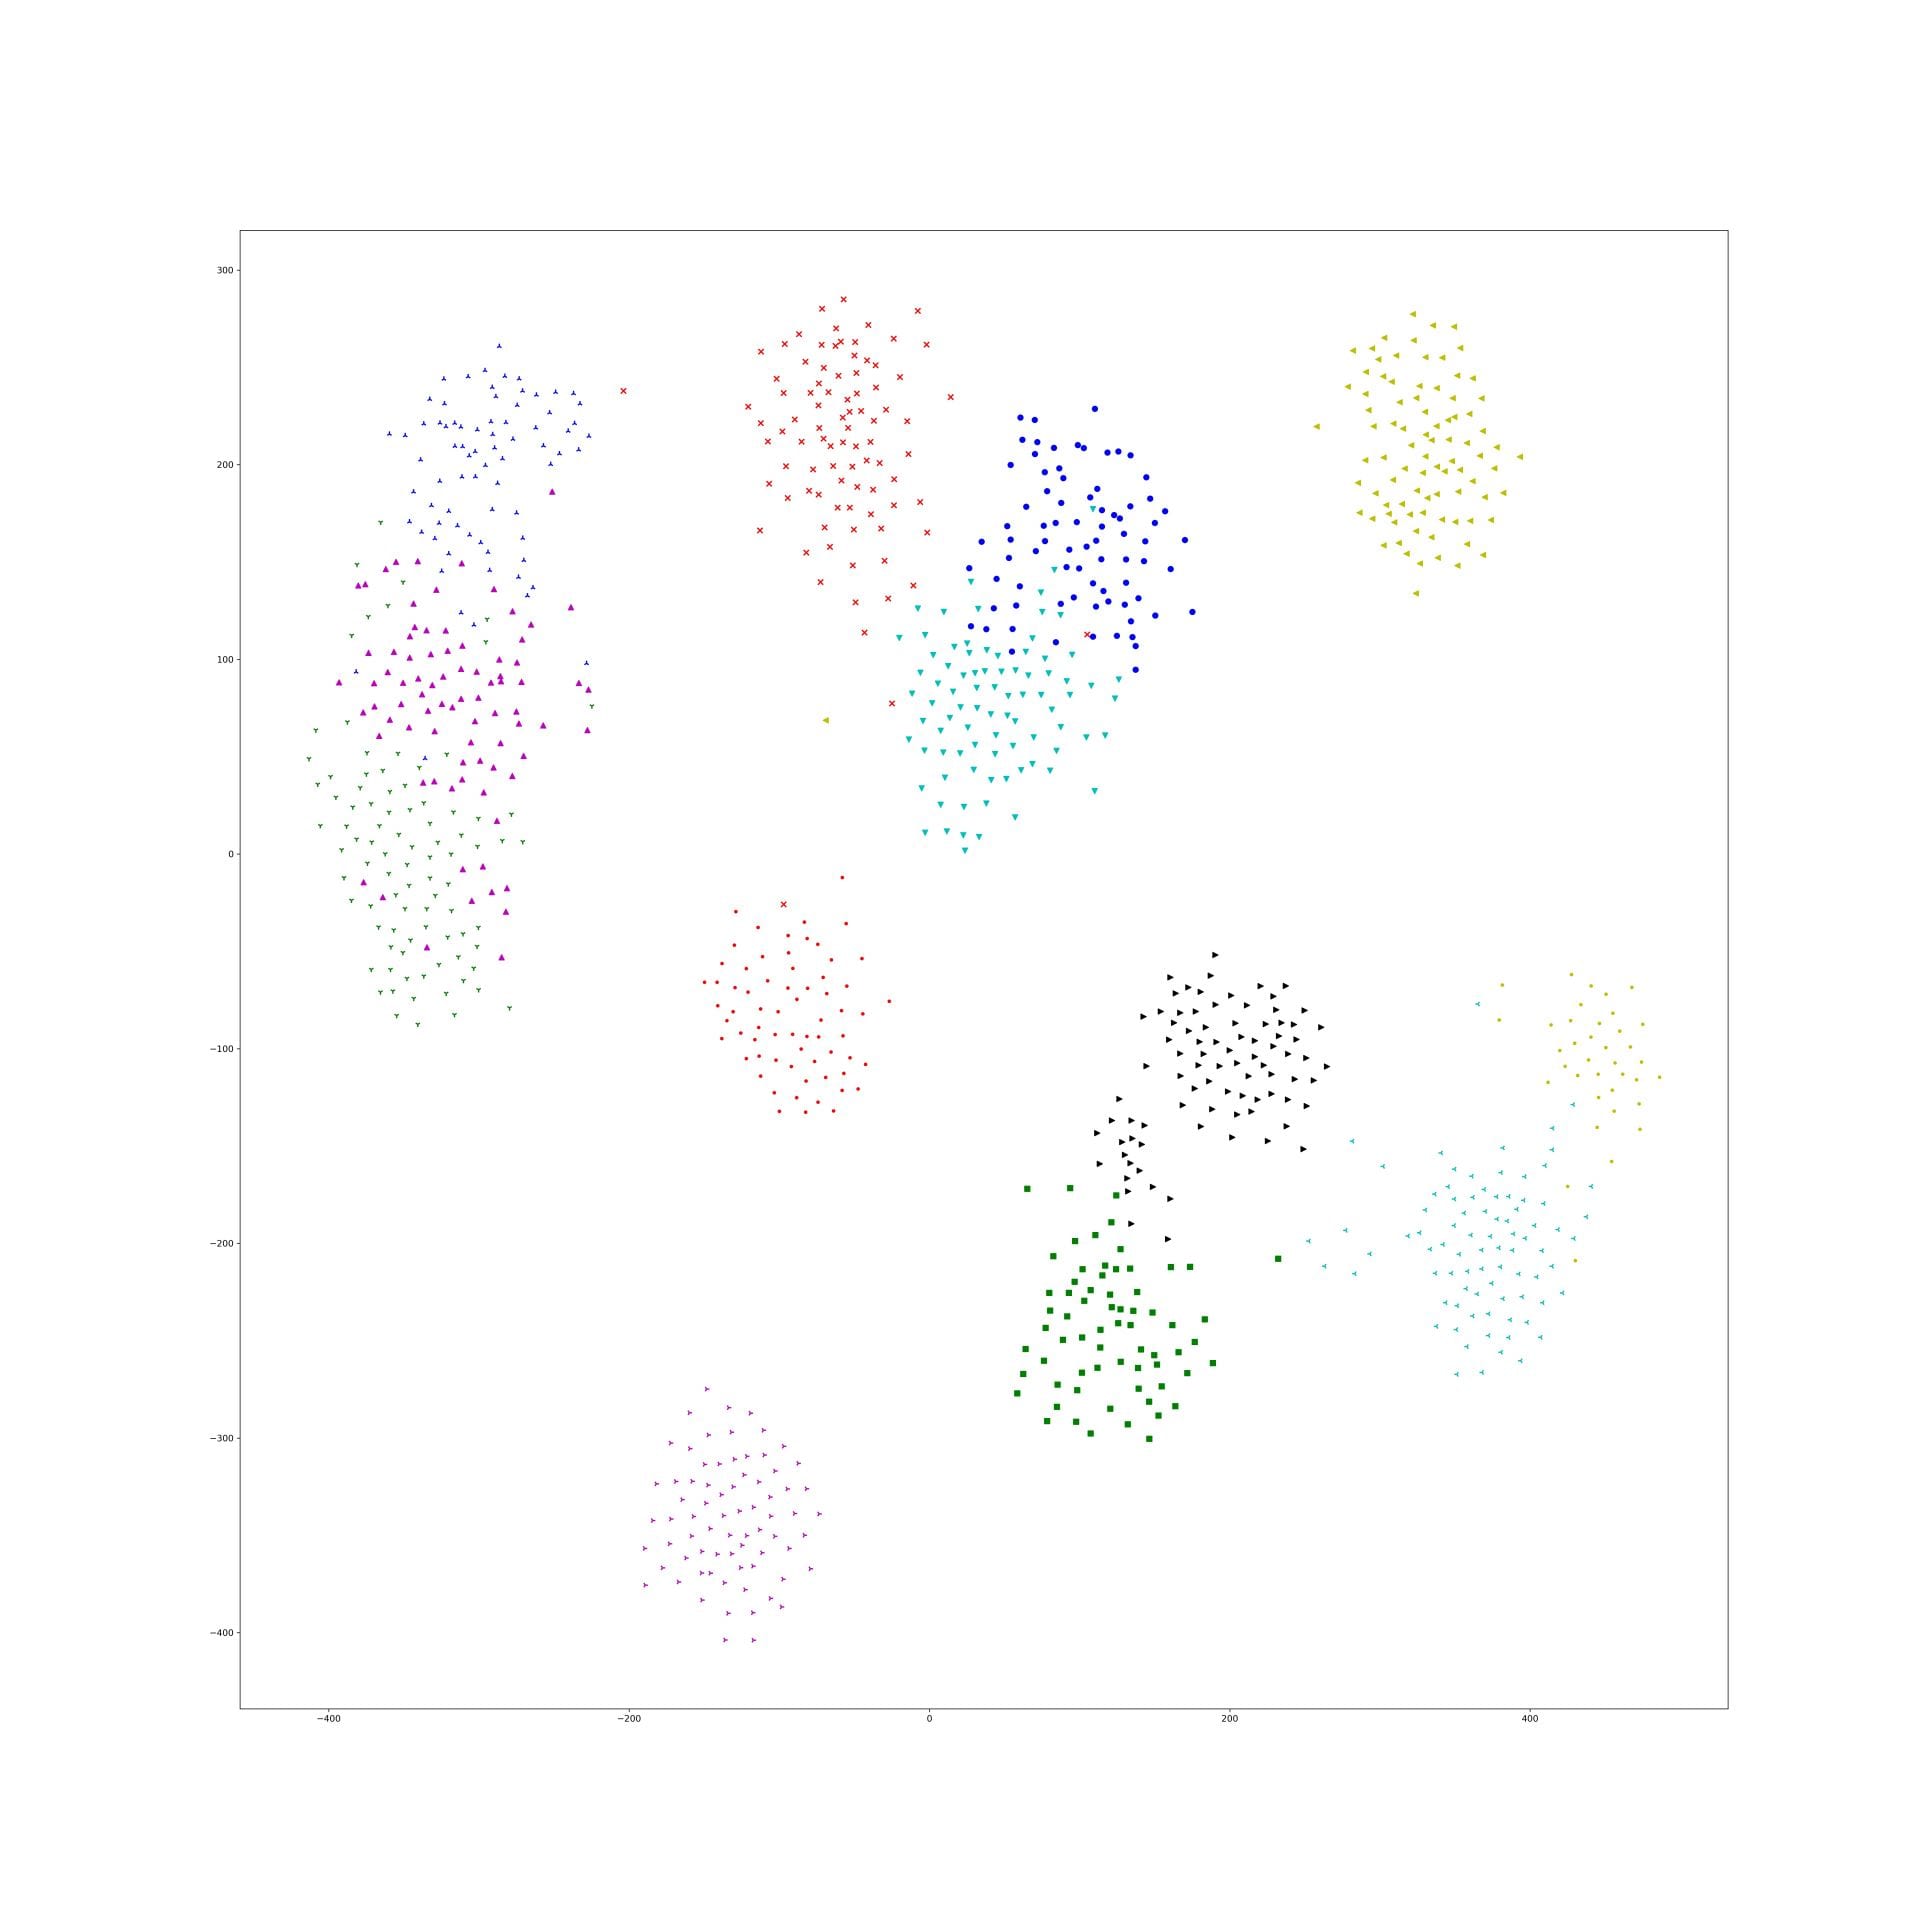
Here is 1e-9:

Here is 1e-10:
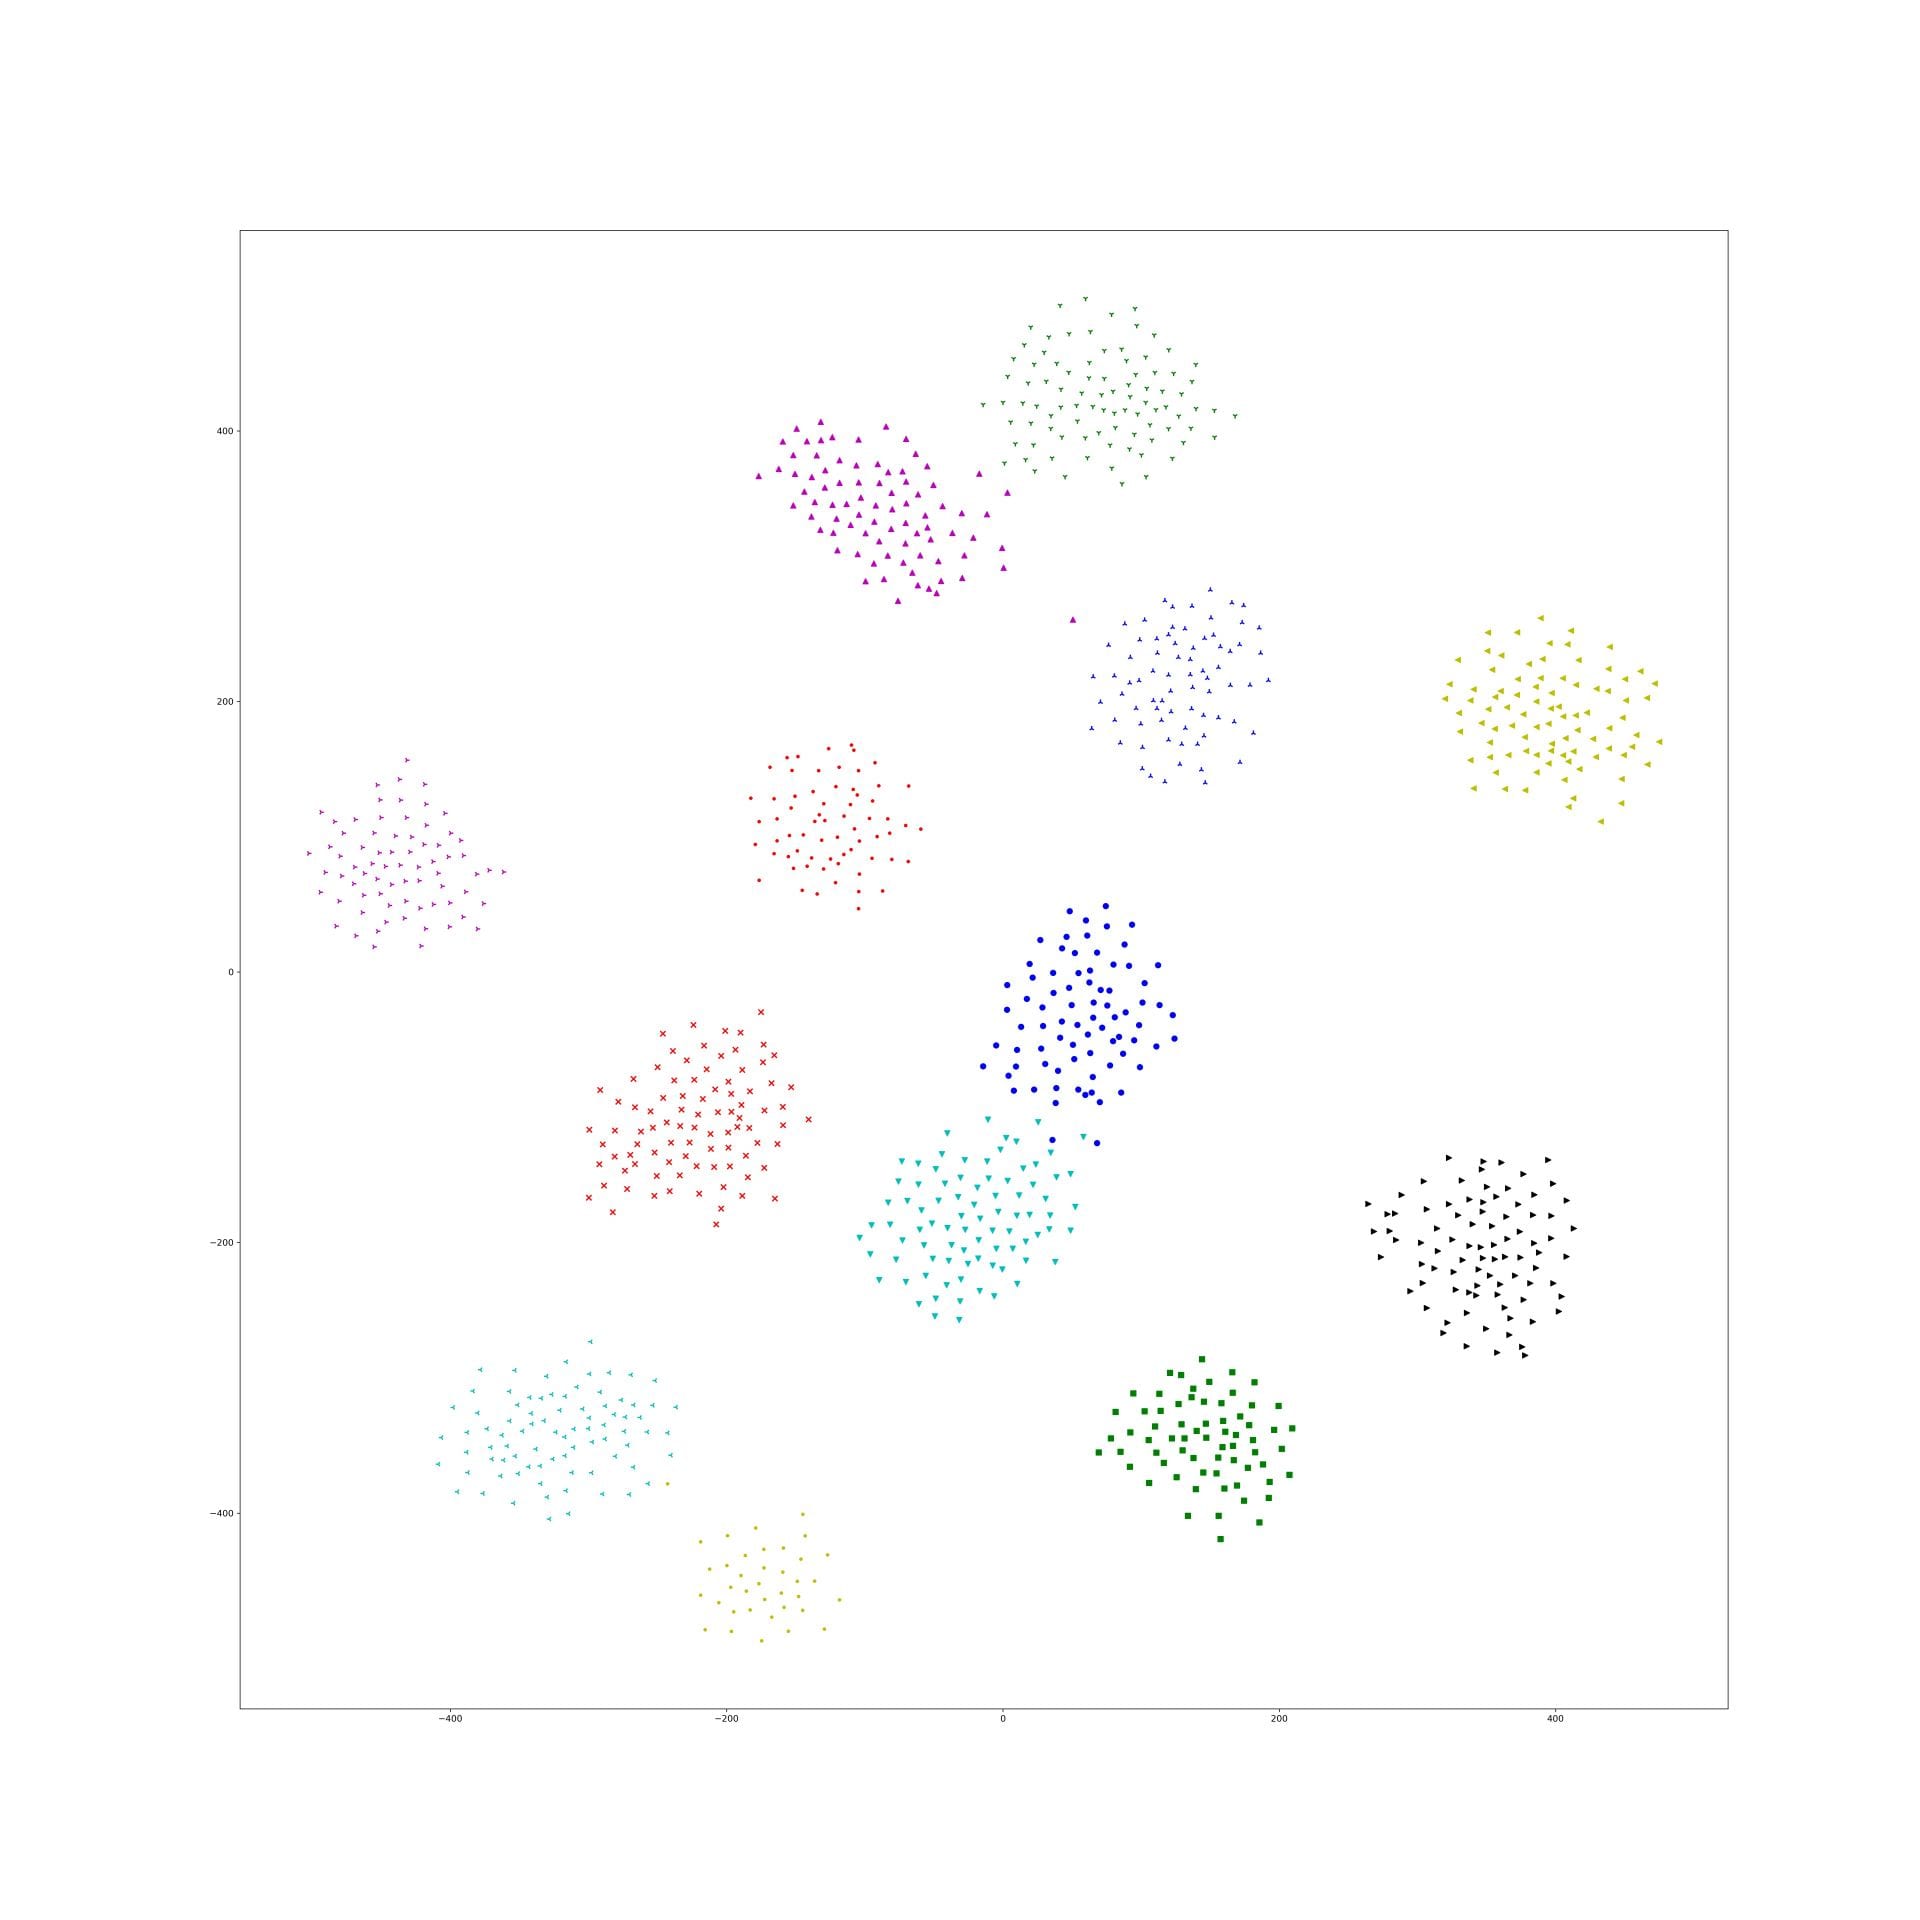

In lambda 1e-9 1e-10, what is in our expectation, the location of each cluster is pretty same and the loose degree of each cluster was similar to the original t-sne.
For a reasonable lambda, I think it is depended on points number and KL distance between two embedding space.