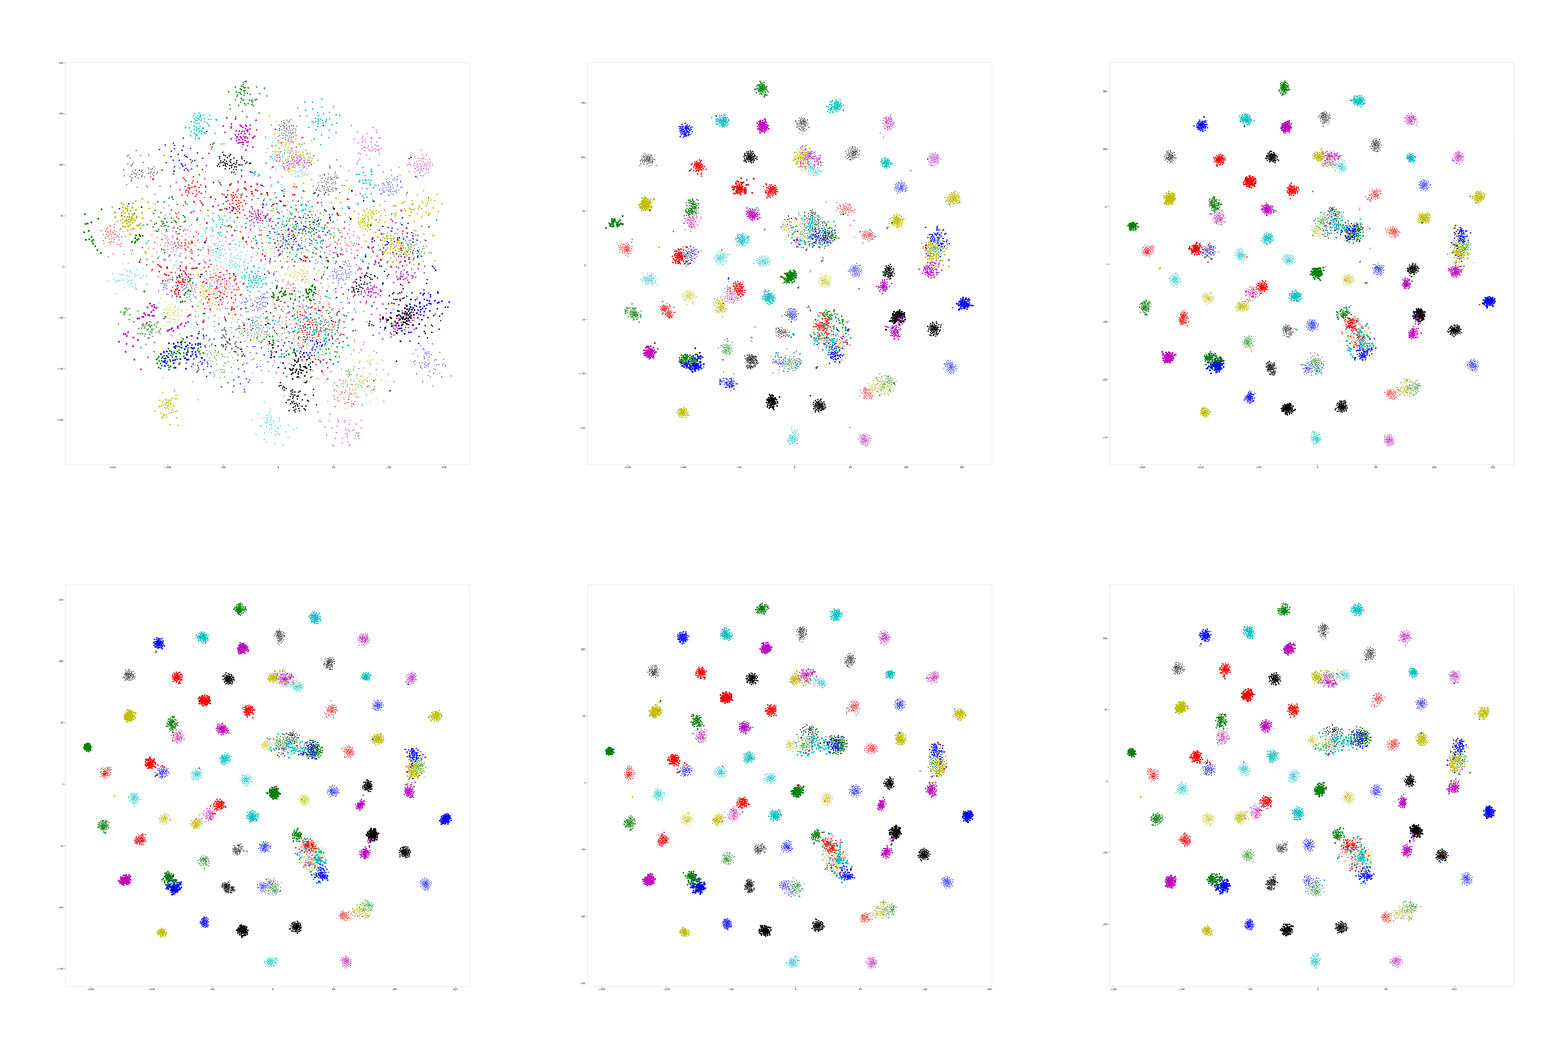
In last week we try to visualize the Npair loss training process by yoked t-sne. In this experiment, we use CUB dataset as our training dataset, and one hundred categories for training, rest of them for testing.
And, we train our Res-50 by Npair loss on those training data for 20 epoch, recording the embedding result for all training data in the end of each training epoch, and use yoked t-sne to align them.
In order to ensure the yoked tsne didn't change the distribution too much, I record the KL distance of tsne plane with embedding plane for original tsne and yoked tsne. It seems that with training processing, the KL distance decrease on both original and yoked tsne. I think the reason is with limited perplexity, a structural distribution is easier to describe on tsne plane. And, the ratio between such KL distance between original and yoked tsne shows that the yoked tsne change a little bit in first three images (1.16, 1.09, 1.04) and keep same distribution in others (among 1.0).
Next step, drawing the image for each epoch is too coarse to see the training process, we will change to drawing image for each several iteration.
NEW IDEA: using yoked t-sne to find how batch size affect some embedding methods.
