Skip to content

So I spent the first half of the week writing up my proposal to present a poster at Grace Hopper this year. Phew, that's done! On to more fun things...

I am working on trying to find the right pipeline to automatically detect markers on four corners of our glitter sheet in an effort to reduce the error in our homography pipeline. The most success I have had so far is with using CALTag markers.

This is an example of a tag - I can specify the size of the tag. In this case, this is a 4x4 marker, and each of the 16 unique QR code in this tag is an 8x8 bit code. I can generate 4 different such tags to be used as our markers, and place them in each of the four corners of our glitter sheet. The rest of this post will focus on some of my tests using these codes and some of the issues I have had with them.

Find each tag individually

If I look at an image of just the 1st tag, and try to find the tag in the image, you can see that all 25 points were found. Similarly, if I look at an image of just the 3rd tag, all 25 points on the tag were found.


However, when I did this test on code 2 and code 4, it did not find any of the points in the marker.

Many iterations and failures later...

After many failed attempts with these markers, I finally succeeded (mostly). I changed the markers from 4x4 to 3x3 markers so that the individual quads would be larger. I then tried to take a picture with one marker alone in the middle of the glitter,and it failed. At this point I realized that the noise from the glitter was causing problems. So, I tried putting the markers on a piece of paper, more or less creating some sort of boundary, and it found the whole marker.

Finally, I arrived at this: I used a piece of cardboard that is exactly the same size as the glitter, and cut it down to look like a border.

(Sorry for the poor picture quality)

It is having a hard time finding marker 2 (the lower right one) no matter where I place it on the border, so I think there is something wrong with that particular marker - I can just print a new random one and try that. But, all of the other 3 markers were found correctly.

Next, I need to try this out in our actual real-world setup and see how it does with a little bit less light.

Question: Will a border like this remove too many pieces of glitter from our system, or will that be okay? This seems to be the only effective way that I can remove noise from the image.

Things to try:

  • I will also try reducing the size of the individual markers and then can also make the border a little smaller, and see if the CALTag code can find smaller sized markers.
  • I can also generate 2x2 codes, so those may actually be better and easier to see for us, so I will try those as well.

1

I now have access to all of the satellite platforms that will be used with the GCA project and I have begun familiarizing myself with the platforms.  I will be attending training seminars for two of the platforms, today and tomorrow, to get a deeper understanding of the systems.

I also have a meeting with Nick Tom at DZYNE today to discuss the metric in preparation for the Phase 2 kickoff meeting presentation scheduled for March 12 and 13.  We also have a government meeting scheduled for Monday March 4.  These appointments are reflected in the GCA calendar.

Robert and I discussed the metric that was proposed in preparation for meeting with Nick over the metric.  Our current plan is for me to focus this upcoming week on gathering data to support the presentation of that metric at the Phase 2 kickoff meeting.  At this point, the data we are looking for is a range of images that support classification of traversability of a road, e.g. dry, wet (no accumulation), 2" deep, 6" deep, undrivable (boating depth).

1

We started this week attempting to fix our weird batch size bug. We talked to Abby, and we determined that this (probably) some weird Keras bug. Abby also recommended that we switch to PyTorch, to stay consistent within the lab, and to avoid this weird bug.

Hong sent us his code for NPair loss, which we took a look at, and started to modify it to work with our dataset. However, its not as easy as just swapping in our images. Hong's model works by saying "we have N classes with a bunch of samples in each, train so X class is grouped together, and is far away from the other N-1 classes". The problem for us is that each images by itself is not in any class. It's only in a class relative to some other image (near or far). We believe our options for the loss function are this:

  1. Change N pair loss to some sort of thresholded N pair loss. This would mean the negatives we would be pushing away from would be, some fraction of the dataset we determine to be far away (for now I'll say 3/4).

if these are the timestamps of the images we have, and we are on image [0]:

[0, 1, 2, 3, 4, 5, 6, 7, 8, 9]

The loss would try to push [0] close to [1, 2, 3] (the images we defined to be close to it, time-wise), and far away from images [4, 5, 6, 7, 8, 9].

1a. We could make this continuous instead of discrete (which I think makes more sense). Where the loss is proportional to the distance between the timestamps

2. Implement triplet loss in pytorch.

(Please let us know if this doesn't make any sense/ we have a fundamental misunderstanding of what we are doing)

1

Stanford's 231n course, which covers some of the most important parts of using CNNs for Visual Recognition, sure provides an extensive amount of information on the subject matter. Although I'm only slowly going through the course, here are some interesting things I've learned so far (they are probably very basic for you, but I'm quite ~thrilled~ to be learning all of this):

  • SVM and Softmax are very comparable types of classifiers, and they can both perform quite well for a variety of classification tasks. However, Softmax provides more ease of use as it outputs probabilities for each in a given image, rather than giving arbitrary values like SVM. Although those arbitrary values also allow for quite simple evaluation, probabilities are much more preferred in most cases.
  • However, even a small change from SVM/Softmax to a simple 2-layer NN can improve results dramatically.
  • The loss function essentially computes the "unhappiness" with the final results of the classification. Triples Loss is an example of such function, but the course (or at least its beginning) focuses on hinge loss.
    • Hinge Loss is mostly used for SVMs.
    • Hinge Loss penalises predictions at zero max(0,), which acts as a margin.
    • Sometimes the squared Hinge Loss is used, which penalises predictions more strictly/strongly.

A part of my learning came from studying and running the "toy example" they explain in the course. Here are the steps I undertook to perform the example (they had some sample code but I adapted it to myself and changed things around a little):

  1. Generate a sample "swirl" (spiral) dataset that would look like this and would contains of 3 classes -- red, blue, and yellow:
  2. Train a Softmax classifier.
    1. 300 2-D points (--> 300 score points with 3 scores each (for each colour))
    2. Calculate cross-entropy loss
      • Compute probabilities
      • Compute the analytic gradient with backpropagation to minimise the cost
      • Adjust parameters to decrease the loss
    3. Calculate & evaluate the accuracy of the training set, which turns out to only be 53%
  3. Train a 2-layer neural network
    1. Two sets of weights and biases (for the first and second layers)
      • size of the hidden layer (H) is 100
      • the only change from before is one extra line of code, where we first compute the hidden layer representation and then the scores based on this hidden layer.
    2. The forward pass to compute scores
      • 2 layers in the NN
      • use ReLu activation function -- we’ve added a non-linearity with ReLU that thresholds the activations on the hidden layer at zero
    3. Backpropagate all layers
    4. Calculate & evaluate the accuracy of the training set, which turns out to be 98% yay!
  4. Results
    • Softmax
    • 2-layer Neural Network

Please find my iPython notebook with all the notes and results on GitHub.

Since last week, we gathered 20000 images. We visualized the triplets to ensure that our triplet creation code was working correctly. We discovered that the last 5000 images we were using were actually from a boat camera instead of the highway cam (we used a youtube video which must have autoplayed). So we had to cut down the images to 15000. We visually verified the triplet creation was correct for the rest of the images.

We also realized that our code was extra slow because we were loading the original resolution images and resizing all 15000 each time we ran. We took some time to resize and save all images beforehand, that way we don't have to waste time resizing every run.

We also had a quick issue where cv2 wasn't importing. We have absolutely no idea why this happened. We just reinstalled cv2 in our virtual environment and it worked again.

We are getting some weird errors when training now. We are a little confused as to why. For some reason, it appears that we need a batch size divisible by 8. This isn't so bad, because we can just choose a batch size that IS divisible by 8, but we just aren't sure WHY. If we don't do this we get an error that says: `tensorflow.python.framework.errors.InvalidArgumentError: Incompatible shapes: [8] vs. [<batch_size>]`. Has anyone seen this error before?

...some of them just look dynamic. Very convincingly so. Even have documentation on "backend framework", etc.

I learned that this week. Twice over. The first frontend template, which I spent chose for its appearance and flexibility (in terms of frontend components), has zero documentation. Zero. So I threw that out the window because I need some sort of backend foundation to start with.

After another long search, I finally found this template. Not only is it beautiful (and open source!) but it also has a fair amount of documentation on how to get it up and running and how to build in a "backend framework."  The demo website even has features that appear to be dynamic. 4 hours and 5 AWS EC2 instances later, after I tried repeatedly to (in a containerized environment!) re-route the dev version of the website hosted locally to my EC2's public DNS, I finally figured out it isn't. Long story short, the dev part is dynamic---you run a local instance and the site updates automatically when you make changes---but the production process is not. You compile all the Javascript/Typescript into HTML/CSS/etc and upload your static site to a server.

Now, after more searching, the template I'm using is this one, a hackathon starter template that includes both a configurable backend and a nice-looking (though less fancy) frontend. I've been able to install it on an EC2 instance and get it routed to the EC2's DNS, so it's definitely a step in the right direction.

My laundry list of development tasks for next week includes configuring the template backend to my liking (read: RESTful communication with the Flask server I built earlier) and building a functional button on the page where a user can enter a URL. Also, on a completely different note, writing an abstract about my project for GW Research Days, which I am contractually obligated to do.

Last week Robert and I met to discuss the project.  While we are funded under the overall grant, our category is more freely categorized as "suggest your own".

The primary team has a general focus on hurricanes; however, we are all keenly aware of the limitations that local and potentially long-term weather that a hurricane will impose on imagery.  Much of the primary team is looking at other spectrums to try to peer through clouds in order to make observations of the ground, structures, and infrastructure.

Given our less constrained task, Robert and I have been considering other extreme events that avoid the problem of weather.  The two best candidates are tornadoes and tsunamis.  For tornadoes, the fronts are fast moving and do not typically linger for days.  For tsunamis, the triggering event is generally an earthquake and is not subject to weather events.  These classes of disasters suggest that we can deliver a product that focuses on the heart of the problem and is not subject to the broad number of ancillary problems associated with hurricanes.

We met this Nick at Dzyne and posed this alternative.  We will be searching for imagery in these areas using the available databases.

The onboarding process is proceeding.  I have been given access to a number of imaging databases and we have scheduled a number of training sessions with the different services.  We will have a large training meeting next Thursday.

As far as future schedule, the next government tag-up is scheduled for Monday (2/25) at 2:30p and Phase 2 Kickoff is scheduled for March 12-13.

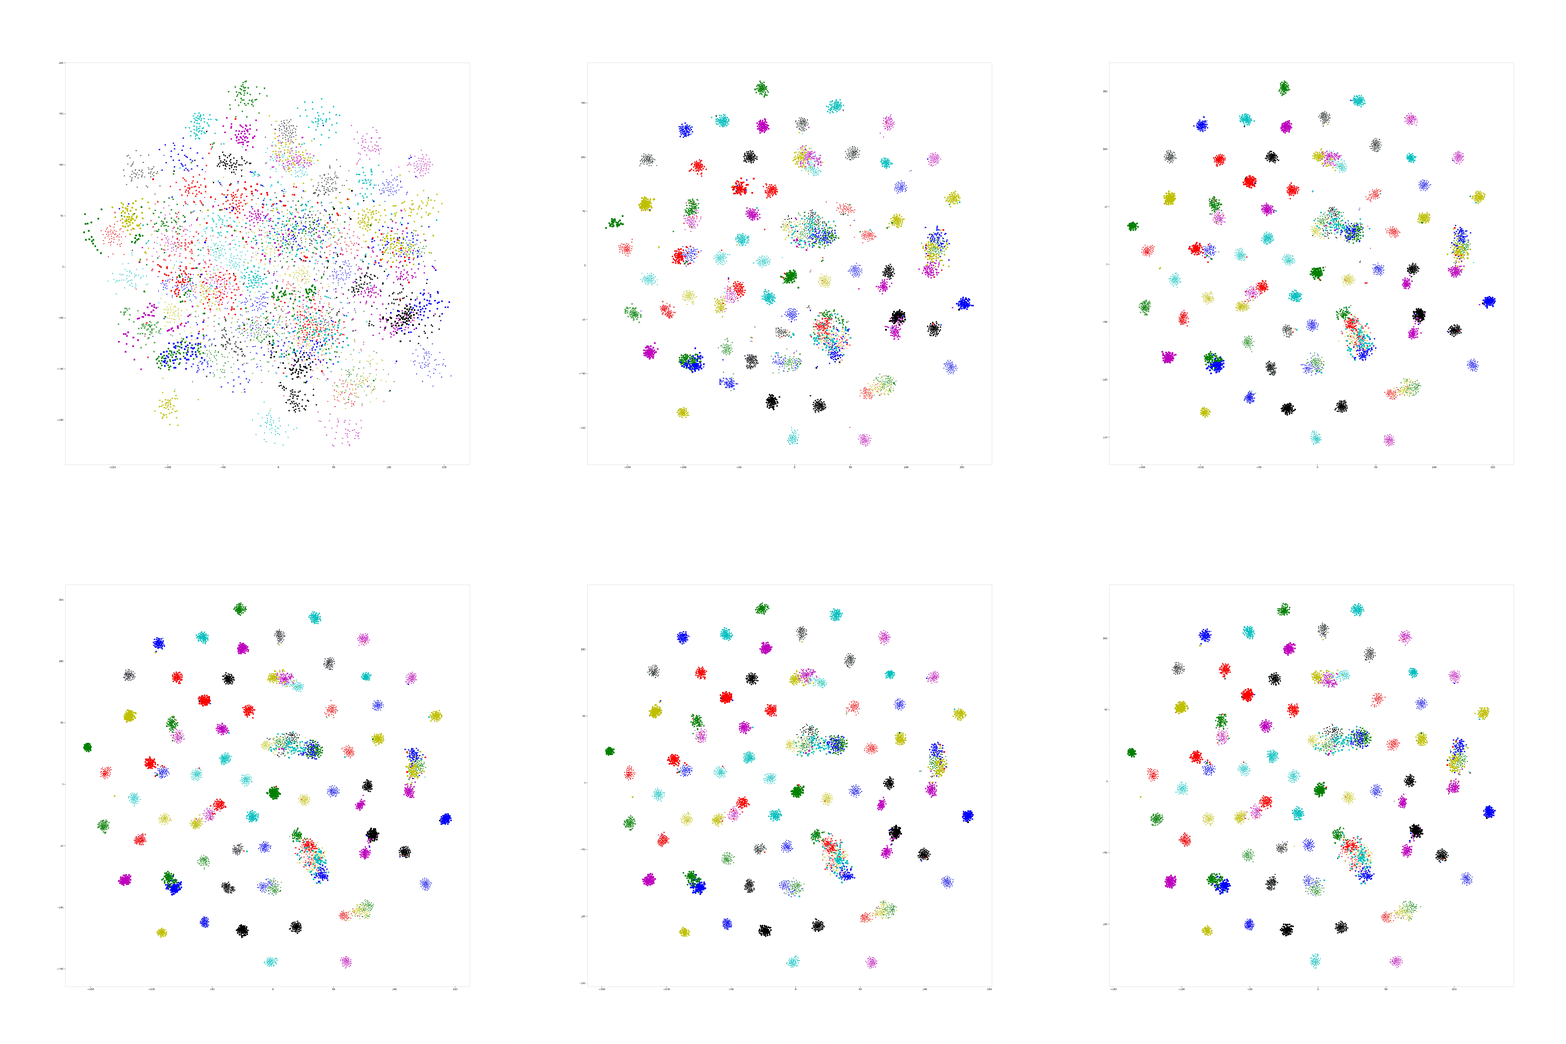
In last week we try to visualize the Npair loss training process by yoked t-sne. In this experiment, we use CUB dataset as our training dataset, and one hundred categories for training, rest of them for testing.

And, we train our Res-50 by Npair loss on those training data for 20 epoch, recording the embedding result for all training data in the end of each training epoch, and use yoked t-sne to align them.

This result is as following:

In order to ensure the yoked tsne didn't change the distribution too much, I record the KL distance of tsne plane with embedding plane for original tsne and yoked tsne. It seems that with training processing, the KL distance decrease on both original and yoked tsne. I think the reason is with limited perplexity, a structural distribution is easier to describe on tsne plane. And, the ratio between such KL distance between original and yoked tsne shows that the yoked tsne change a little bit in first three images (1.16, 1.09, 1.04) and keep same distribution in others (among 1.0).

Next step, drawing the image for each epoch is too coarse to see the training process, we will change to drawing image for each several iteration.

NEW IDEA: using yoked t-sne to find how batch size affect some embedding methods.

Glitter

I have solved some more issues with the Double Glitter screen mapping. First, the positives. Below is a more reasonable image where, upon looking at individual pieces of glitter, these screen mapping points seem reasonable.

There is a more dense cloud of points near the middle of the screen, but there is a decent spread and no points are off the screen.

With that said, there is still quite a few glitter pieces that are not being mapped correctly. Specifically, there is about 1800~ pieces of glitter not being mapped correctly out of 5300. Looking at certain pieces of glitter that are failing to map, I am seeing something like the image below:

This is an image of mask. The yellow shows the low frequency masking, and the X,Y location is what the high frequency mask says the point should be. Since that X,Y is not in the yellow, the final mask is all 0's so no mapping is made for that glitter piece.

I have fixed the comparing of floating point values issue, but for this current problem, perhaps revisiting color correction is appropriate. Either that or simply just say that if you are "close enough" to the yellow square, count it.

Starcraft

I have successfully created a very basic pipeline that can take images from a live stream and obtain their map images to use in my prediction model. I used the Twitch API to obtain a preview image of the stream and pass that onto a python script that resizes the image and predicts using my model. For example, here is a picture of a Korean Starcraft Player streaming his game!

I am interested in exploring running a program on the player's computer to obtain more data easily (such as how many resources that player has or that player's apm), as other Twitch extensions do something similar. For the moment, I will refine this pipeline and once it is at a more stable state I will revisit my model and explore LSTMs more as a potential new model. In addition, I would like to explore using more data (if I can get it) besides just the map image.

From my previous posts, we have come to a point where we can simulate the glitter pieces reflecting the light in a conic region as opposed to reflecting the light as a ray, and I think it is more realistic that the glitter is reflecting the light in a conic region. This means that when optimizing for the light and camera locations simultaneously, we actually can get different locations from we pre-determined to be the actual locations of the light and camera. Now, we want to take this knowledge and move back to the ellipse problem...

Before I could get back to looking at ellipses using our existing equations and assumptions, I wanted to first test a theory about the foci of concentric ellipses. I generated two ellipses such that a, b, c, d,  and e were the same for both, but the value of f was different. Then, I chose some points on each of the ellipses and tried to use my method of solving for the ellipse to re-generate the ellipse, which worked as it had in the past.

I then went to pen & paper and actually used geometry to find the foci of the inner ellipse:

I found the two foci to be at about (-13, 7.5) and (11, -7.5). Now, using these foci, I calculated the surface normals for each of the points I had chosen on the two ellipses (so pretend the foci are a light and camera). In doing so, I actually found that the calculated surface normals for some of the points are far different from the surface normals I got using the tangent to the curve at each point:

The red lines indicate the tangent to the curve at the point, while the green vector indicates the surface normal of the point if the light and camera were located at the foci (indicated by the orange circles).

Similarly, I calculated and found the foci for the larger ellipse to be at (-15.5, 9) and (13.5, -9), and then calculated what the surface normals of all the points would be with these foci:

Again, the red lines indicate the tangents and the green lines indicate the calculated surface normals.

While talking to Abby this morning, she mentioned confocal ellipses, and it made me realize that it is possible that there is a difference between concentric and confocal ellipses. Namely, I think that confocal ellipses don't actually share the same values of a,b,c,d,e...maybe concentric ellipses share these coefficients with each other. And I think that is where we have been misunderstanding this problem all along. Now I just have to figure out what the right way to view the coefficients is...:)