In the image embedding task, we always focus on the design of the loss and make a little attention on the output/embedding space because the high dimensional space is hard to image and visualized. So I find an old tool can help us understand what happened in our high-dimension embedding space--SVD and PCA.
SVD and PCA
SVD:
Given a matrix A size (m by n), we can write it into the form:
A = U E V
where A is a m by n matrix, U is a m by m matrix, E is a m by n matrix and V is a n by n matrix.
PCA
What PCA did differently is to pre-process the data with extracting the mean of data.
Especially, V is the high-dimensional rotation matrix to map the embedding data into a in coordinates and E is the variance of each new coordinates
Experiments
The feature vector is coming from car dataset(train set) trained with standard N-pair loss and l2 normalization
For a set of train set points after training, I apply PCA on with the points and get high-dimensional rotation matrix, V.
Then I use V to transform the train points so that I get the new representation of the embedding feature vectors.
Effect of apply V to the embedding points:
- Do not change the neighbor relationship
- ‘Sorting’ the dimension with the variance/singular value
Then let go back to view the new feature vectors. The first digit of the feature vectors represents the largest variance/singular value projection of V. The last digit of the feature vector represents the smallest variance/singular value projection of V
I scatter the first and the last digit value of the train set feature vectors and get the following plots. The x-axis is the class id and the y-axis is each points value in a given digit.
The largest variance/singular value projection dimension
The smallest variance/singular value projection dimension

We can see the smallest variance/singular value projection or say the last digit of the feature vector has very small values distribution and clustered around zero.
When comparing a pair of this kind of feature vector, the last digit contributes very small dot product the whole dot product(for example, 0.1 * 0.05 =0.005 in the last digit). So we can neglect this kind of useless dimension since it looks like a null space.
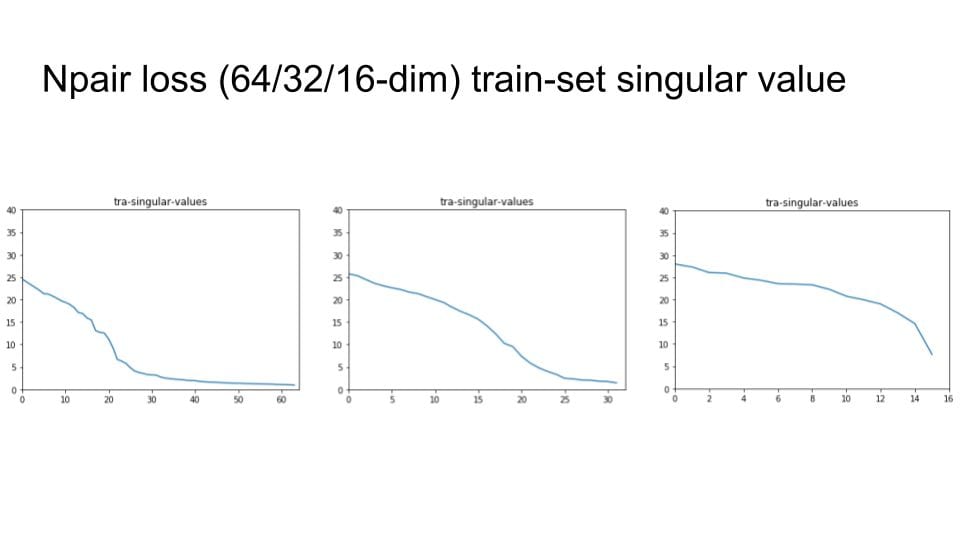
Same test with various embedding size
I try to change the embedding size with 64, 32 and 16. Then check the singular value distribution.
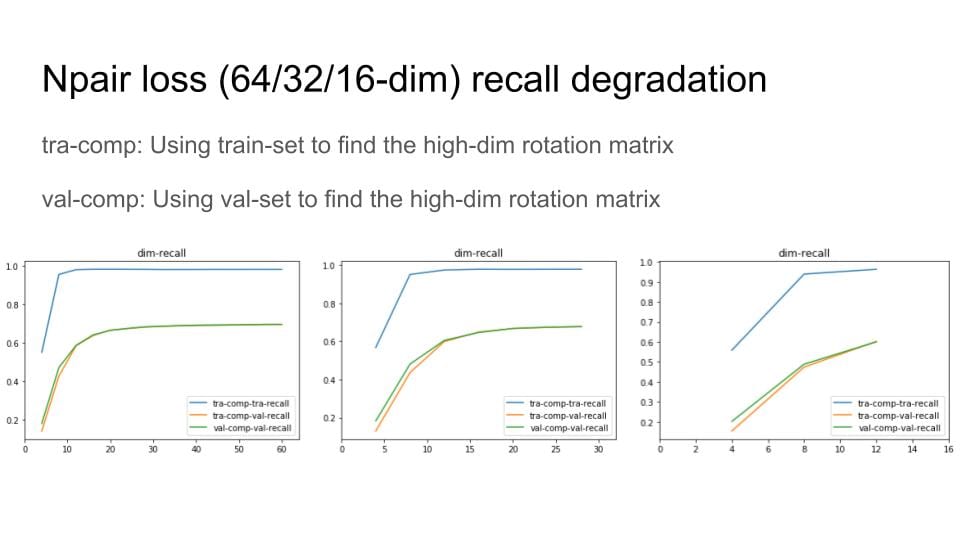
Then, I remove the digit with small variance and Do Recall@1 test to explore the degradation of the recall performance
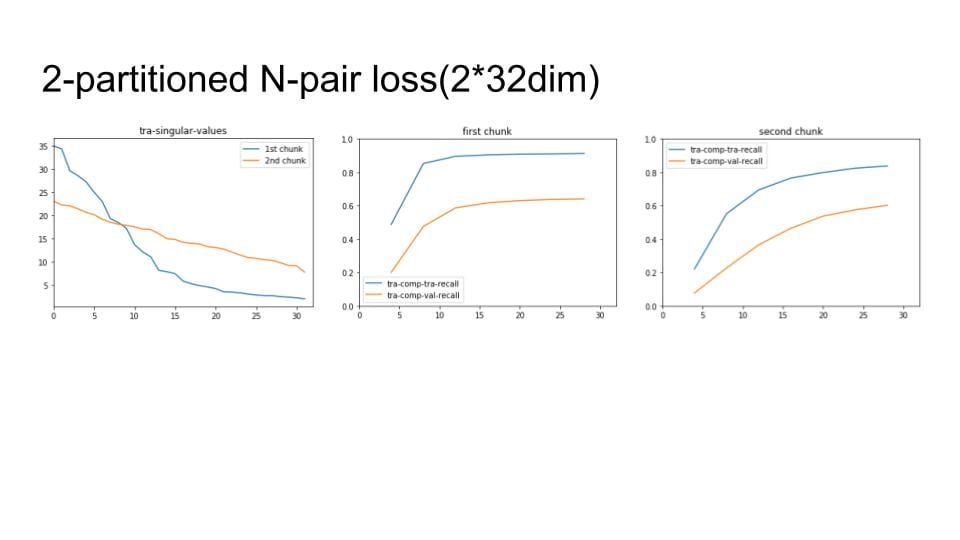
Lastly, I apply the above process to our chunks method