Skip to content

In order to figure out generalization ability of different embedding method, I get feature vectors of CAR dataset which is training by different loss function.

For all loss function, the dataset is split into training data (first 100 categories) and validation data (rest). and it will show the t-sne for training, testing and all data following:

1.  Lifted Structure (Batch All):  training on Resnet-18.

2. Triplet loss (Semi-Hard Negative Mining): training on Resnet-18.

3.Easy Positive Semi-Hard Negative Mining: training on Resnet-18.

4. Npair Loss : training on Resnet-18:

5. Histogram loss: training on Resnet-50:

1

With Hong and Abby's help, we were able to get the heatmap up and running on our model. Here you can see the similarity visualization across a couple of our classes as time passes (Left image is always the first image in the class, the right image advances timewise):

class80:

class120:

It appears as if these blobs are following groups of cars/ specific cars. Which would mean that it must be learning something about cars themselves. Its kinda hard to see how specifically it is paying attention to certain cars when they are close together, due to the fact that the resolution of the heatmap is 8x8.

One concern I have is that it only seems to care about some cars and not others. Would anyone have any insight as to why? This could mean that, if we were to use the embedding to identify cars for our amber-alert problem, we could get 'unlucky' and miss the car we actually care about.

Next week:

  • Do this visualization on our training data too
  • Figure out our next steps

1

In order to accomplish our goal of figuring out which pictures were being misplaced by our embedding network, we took some time to introspect on Hong's model accuracy calculation function. In doing this we learned/ confirmed some things about how the linear algebra behind embedding works!

We saw how, by multiplying the high dimensional space vector by its transpose, will give us the distance from each vector to every other vector. We then sort to find the closest vector to each other vector. We set the prediction of the given vector to whatever the class is of the closest other vector to it.

Here is an example image that the network misclassified (raw image on left, highlighted similarities on right):

Test Image (from ~1min from video start):

Closest image in High dimensional space (from ~30min from video start):

Here are the images again with some highlighted similarities:

Test Image:

Predicted image (closest in high-dimensional space):

Another similarity we saw was the truck in the far right lane, and far left lane. They look fairly similar, and it would be reasonable for them to be this far apart within the time period of one of our classes.

The first glaring issue we saw were the trucks/ lack of trucks in the bottom left. We then thought it may be fine, because it makes sense that, within a class it is likely for new vehicles to enter the scene from this point, so the model might allow for a situation like this.

We attempted to use the heatmap, we have most of it set up, we gave it a first attempt, but we just think we are plugging in the wrong vectors as input. (we can talk to Hong/ Abby more about this). Here is our first attempt (lol):


Next week:

  • Find the right vectors to use for our heatmap to confirm the car-tracking ability of the model

I spent a bit of time this last week working on the "are these similarity maps from the same class or different class" classifier. As a first pass of getting this running, I took my pair of 8x8 heatmaps, scaled them up to 32x32 and concatenated them in the depth direction to have an input to a CNN that is (32x32x2), with a binary label for whether the pair are from the same class or not. I have a training dataset w/ ~300k pairs, 50% of which are from the same label, 50% from different labels, and a test dataset of ~150k pair, also equally split.

I then train a network with cross entropy loss and am getting roughly 75% training accuracy, and 66% testing accuracy (better than random chance!). But I actually don't think this should work, for a couple reasons. One: you can reasonably imagine the case where you get identical heatmaps with different labels (a pair of images from the same class that focus on the same regions as a pair of images from different classes). Two: actually looking at the images, I kind of don't believe that there are obvious differences to be keying on.

I always like to play the "can a human do this task" game, so for each of the below images, do you think that the images from the same class are on the left or the right? (Answers are below the images in white text)

same on left

same on left

same on right

Based on last weeks discussion, I am testing the accuracy of using purely in game data that I can obtain both from replays and from a live stream. This includes Resources (Minerals and Gas), Current Population, Current Max Population, Race, GameID (to track data across one game), Current In Game Time, and finally who wins. No image data is being processed here.

From the replays I collected 53k snapshots over 406 games. Removing snapshots that had a current time of < 60 seconds (because the beginning of the game is not interesting), I was left with 48k snapshots.

Next I spent time trying to find a model that works well with the data.

Running a grid search with SVM, I found the RBF kernel with C=1000 and gamma =0.001 to be the best parameters. I achieved an accuracy of ~66%, but there is waaaaaaay too much variance at the moment. For example:

Running AdaBoost with 100 estimators did much better with ~75% accuracy:

Note:

Both graphs were created with no normalization of data (scaling ) and with keeping the column GameID in the dataset for training.

Questions:

  • With the above models, I am including the GameID, such that a single game with say 10 snapshots will all have the same GameID. Without this column AdaBoost performs about 10% worse. What is the justification for keeping other than "it gives me better accuracy"?
  • Currently nothing in the data is normalized. Should values such as resources or population be normalized over the dataset? Should it only normalize per game?

For Next Week:

  • Keep working on the models
  • test model over one game and see how the prediction does
  • Compare to visual data classifier and look into how to possibly combine them together.

This week we focused on making small improvements to our process/ model.

We fixed our training/test set so there is a time gap between the training and test classes. Before, the last image in each training class would have been directly adjacent, time-wise, to the first image in one of the testing classes. While validating, this would mean that some of the images would be almost identical to images it has already seen in training.

We also did some of the other tests, like the overfitting test to see that the loss went to 0, and it did.

Another issue, which we posted about before, was that we were getting our training accuracy to be 0. We found this .......

acc_tra = 0#recallAcc(Fvec_tra, dsets_tra.idx_to_class)  (oof)

Our goal is also to see some of the images that the network is getting wrong (what class did the network guess/ what class is it supposed to be). We're close to getting this done. Part of the code maps an arbitrary class name to a specific index ('dog' -> class 7).  We were able to obtain this specific index of the expected/actual of the incorrectly labelled images. All that's left is to translate this index back into the original class names. Then we can see guessed/actual of the wrong images.

We also switched our model over to resnet50 (previously resnet18), and retrained over 10 epochs.


For next week:

  • Finish up checking out mislabelled images
  • Use Abby's heatmap to visualize similarity within a class (to confirm the model is 'tracking cars')

There are some weeks that I look back and wonder how I felt so busy and got so little done. I was out sick Monday, at the Geo-Resolution conference at SLU all day Tuesday, and gave a talk + led a discussion at a seed manufacturing company yesterday about deep learning and understanding image similarity. Beyond that, I've had a few scattered things this week:

  • I put together our CVPPP camera ready submissions (we really need to get better about using the correct template when we create overleaf projects)
  • I have continued bouncing ideas around with Hong (why are the low level features so similar??)
  • Doing some AWS configuration things for the Temple TraffickCam team (apparently the elastic file system is really slow for serving up images over http?)
  • Talking w/ Maya about glitter centroid mapping from scan lines
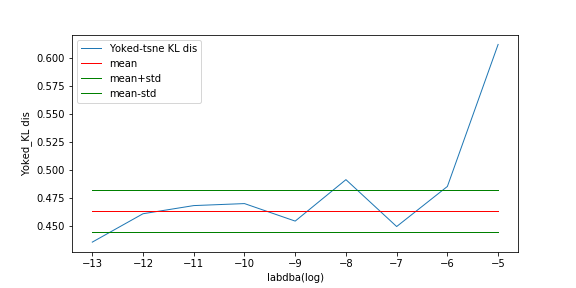
  • Spent some time thinking about what would go into an ICML workshop submission on the generalizability of different embedding approaches: https://docs.google.com/document/d/1NEKw0XNHtCEY_EZTpcJXHwnC3JKsfZIMhZzfU9O0G4I/edit?usp=sharing

I'm trying to figure out how to get better blocks of time going forward to really sit down and really focus on my own research. To that end, the thing I'm excited about right now and don't have a huge update on but managed to actually work on a bit this morning is following on from some conversations with Hong and Robert about how we could use our similarity visualizations to improve the quality of our image retrieval results.

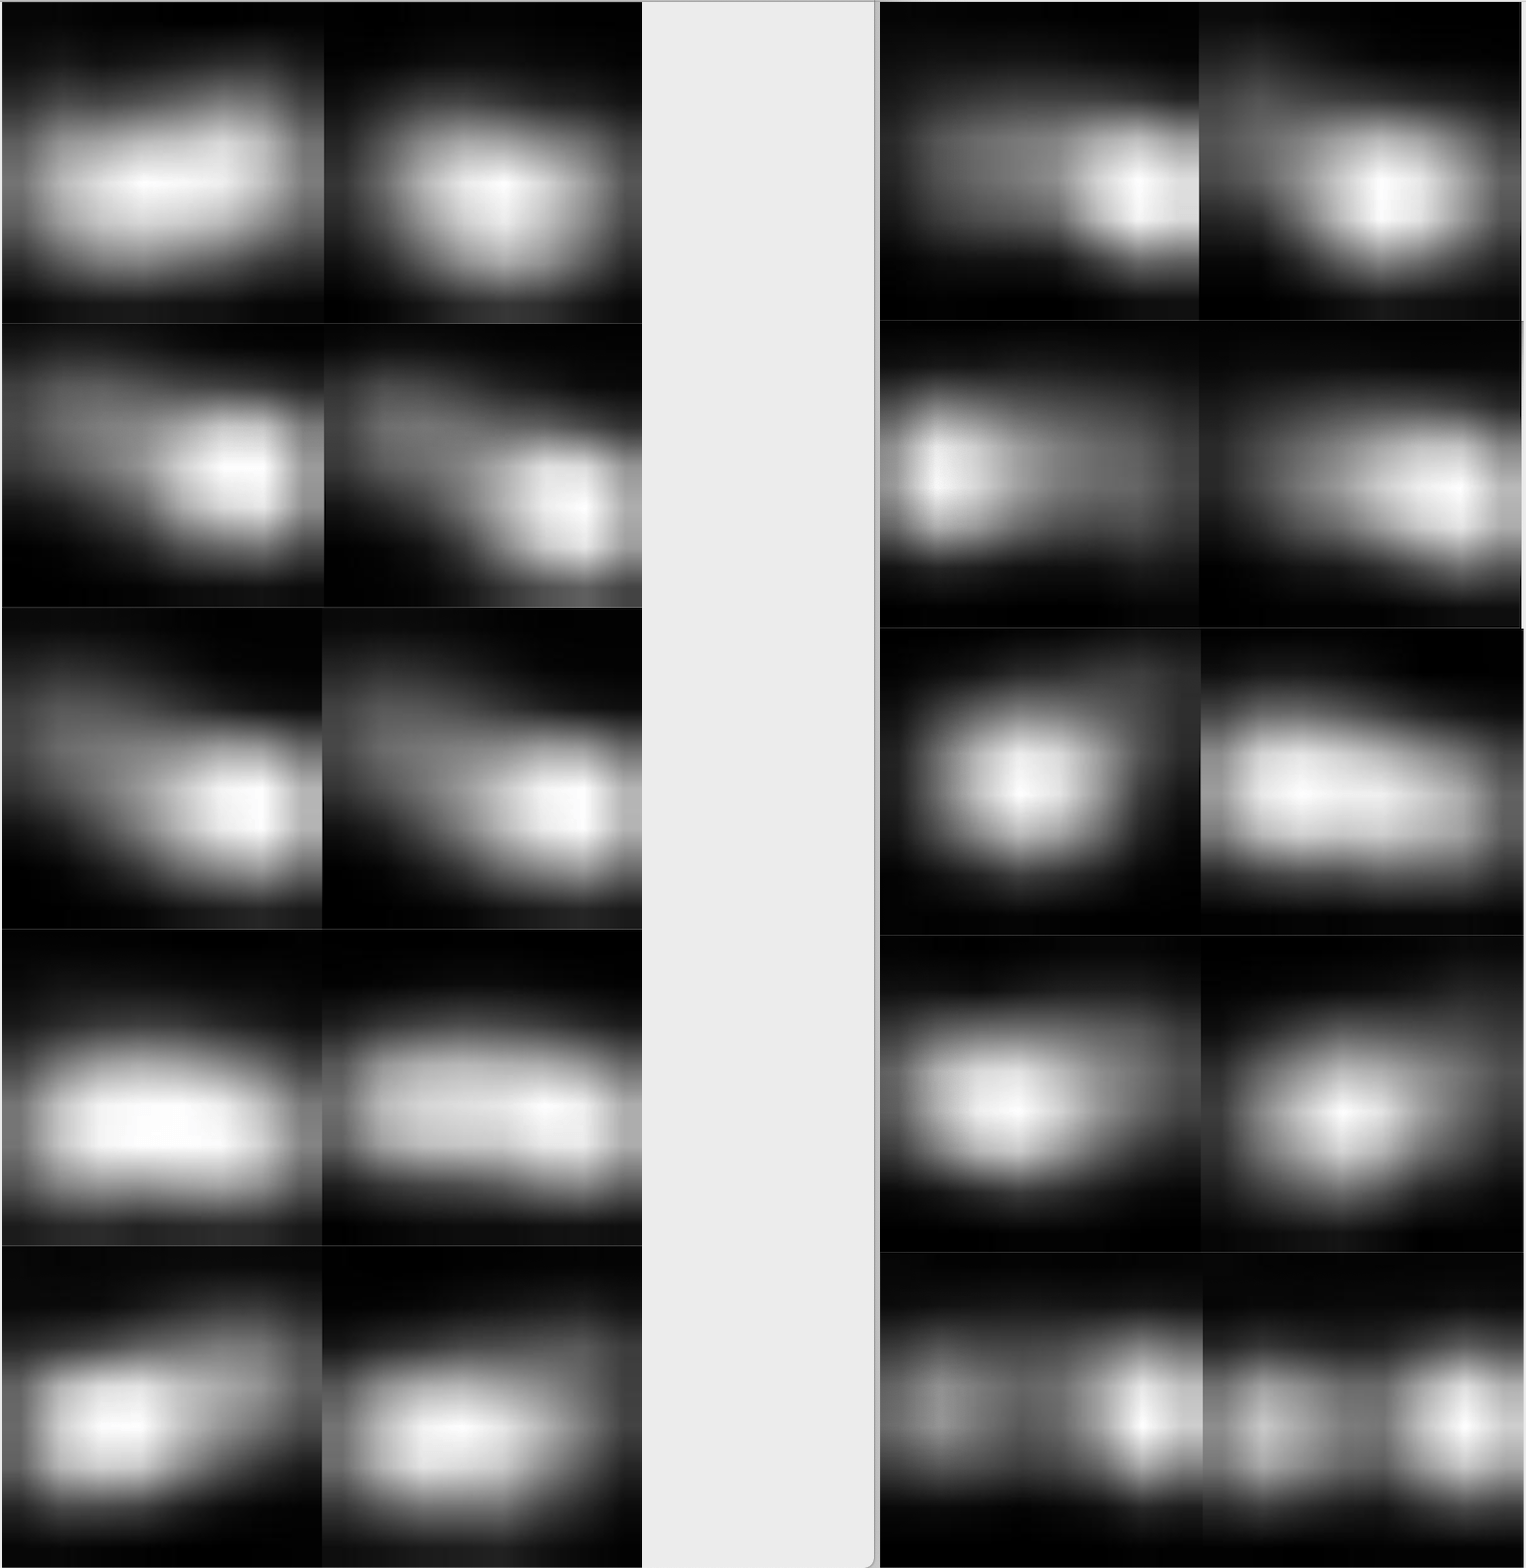
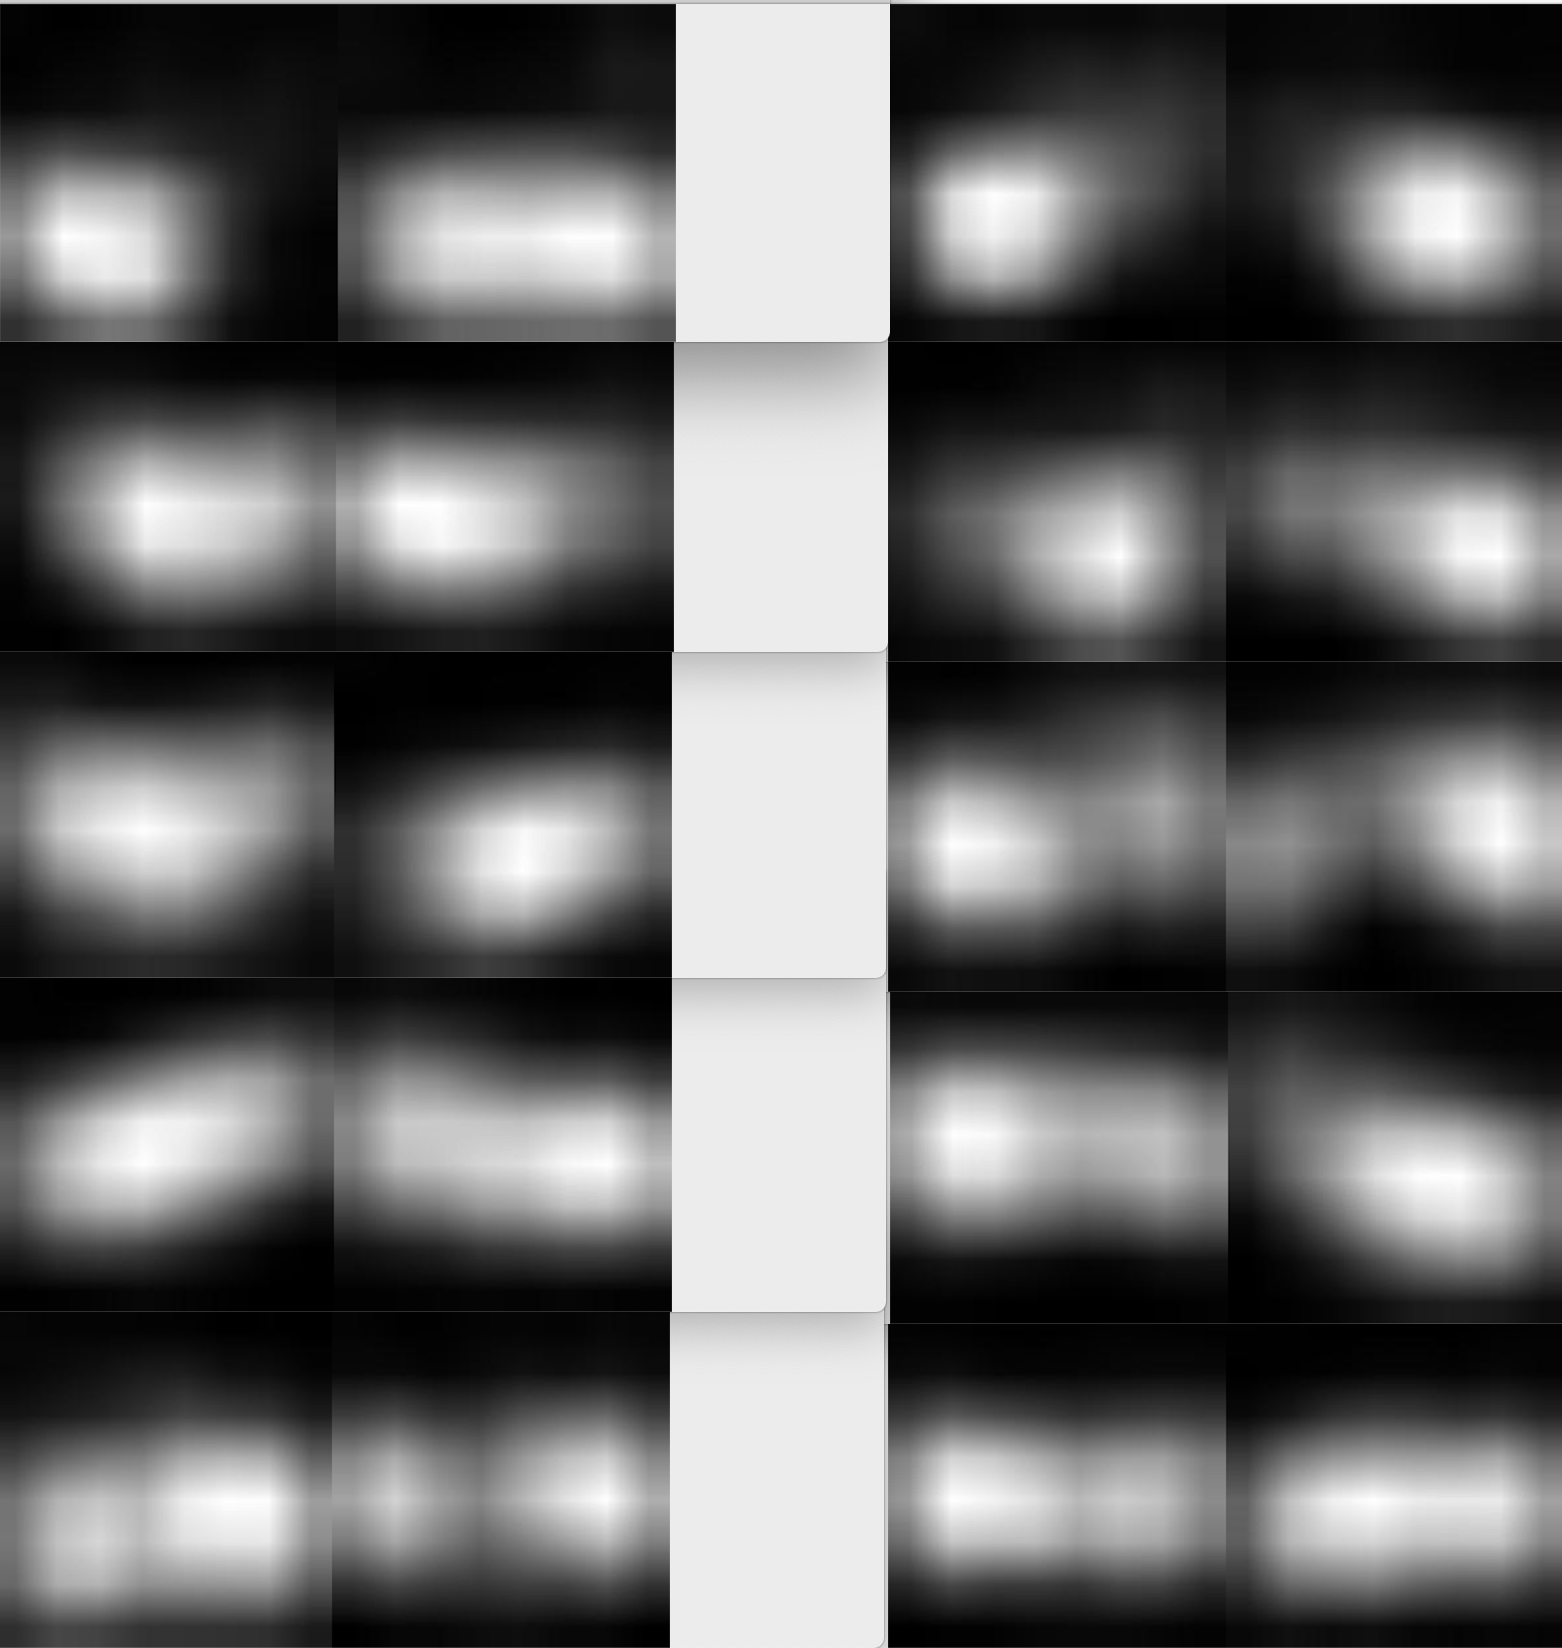
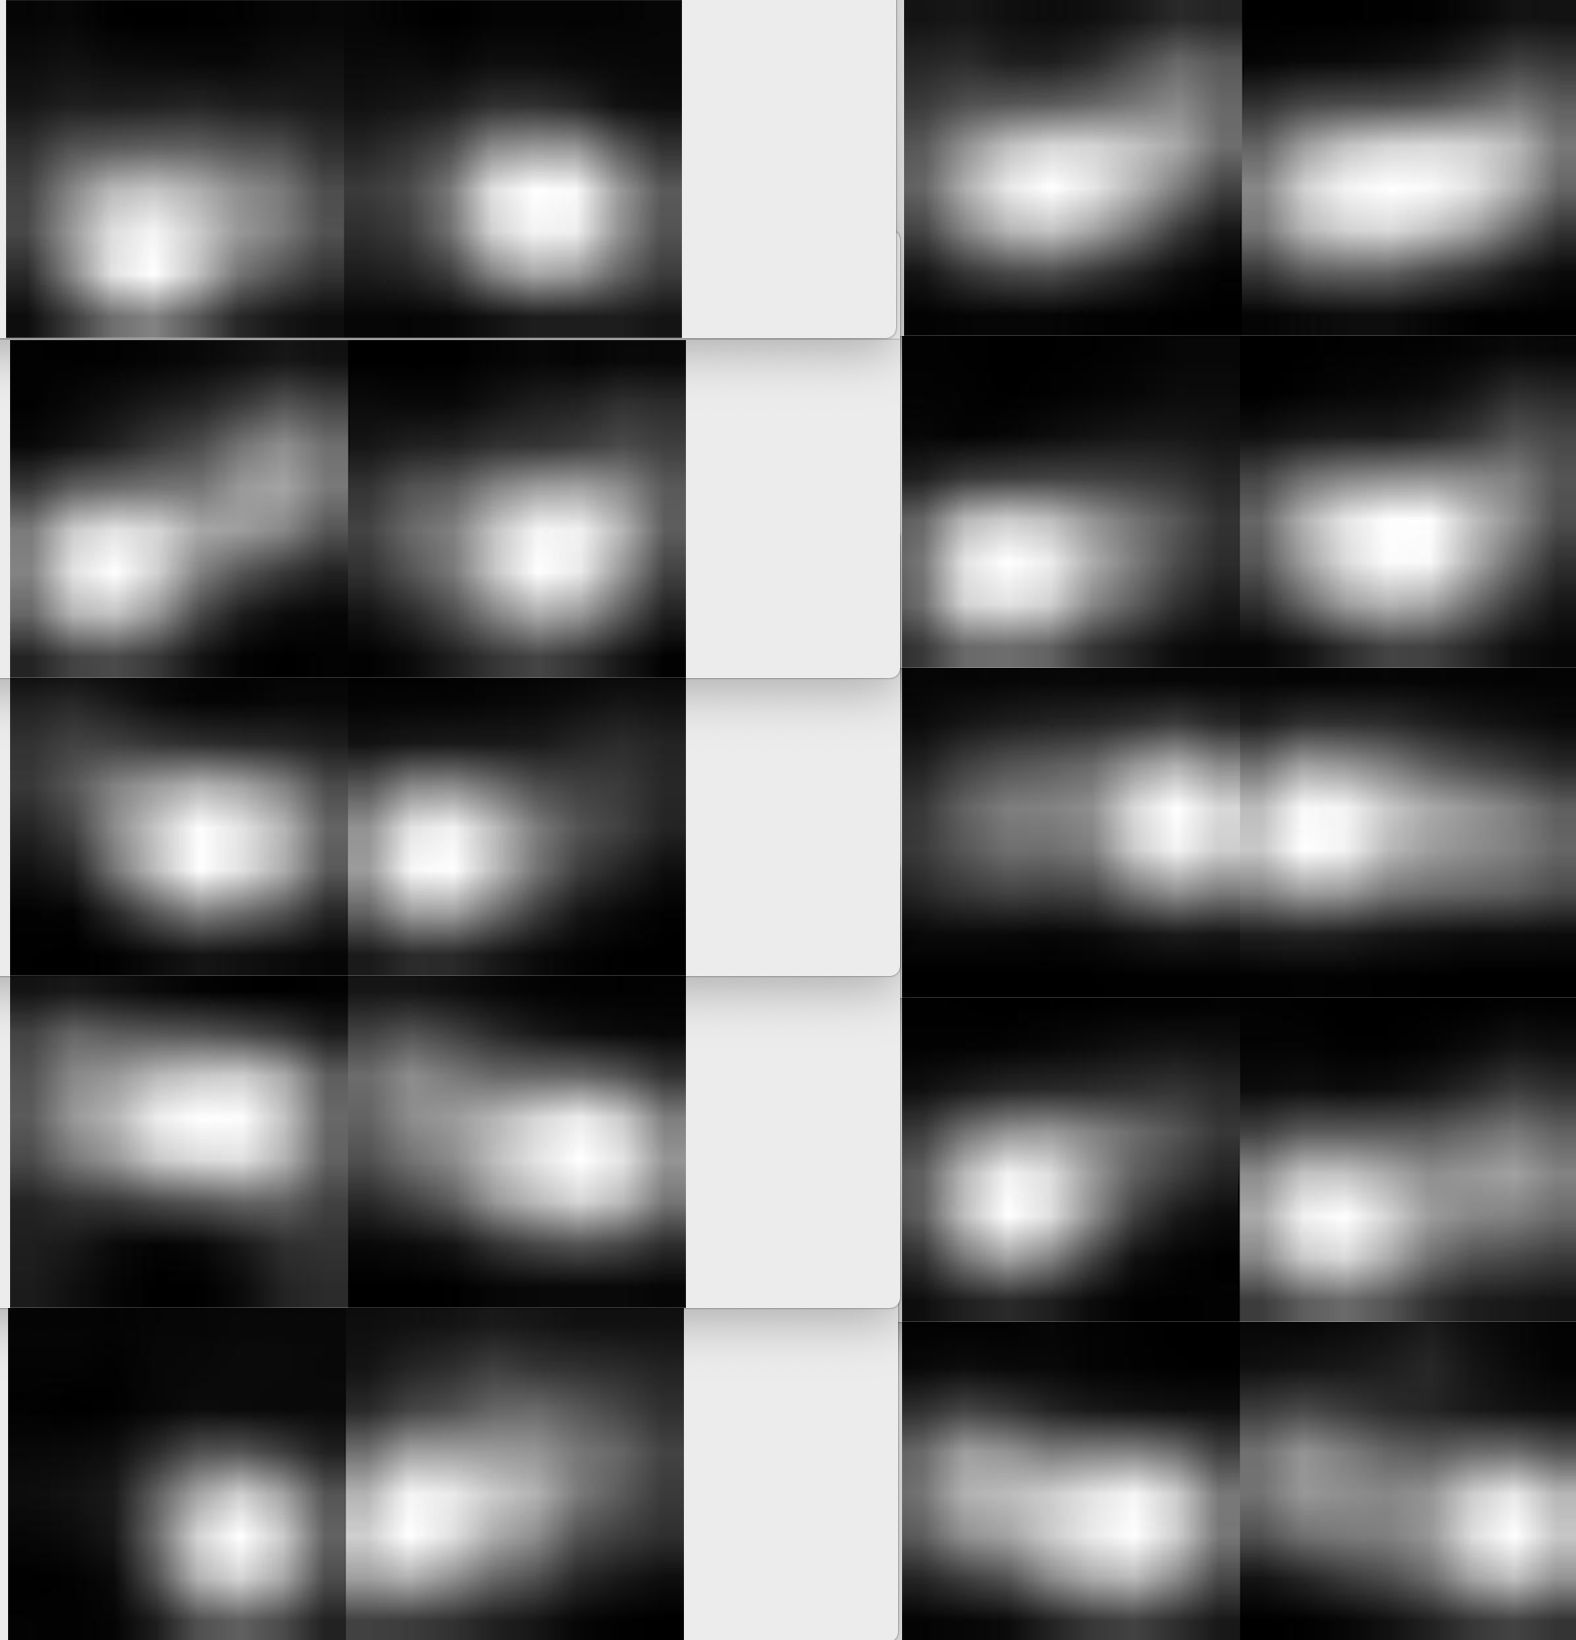
Recall that our similarity visualizations show how much one image looks like another, and vice versa. We additionally know if those images are from the same class or not:

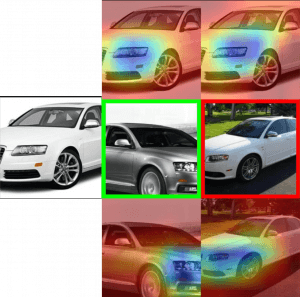
Could you actually use this spatially organized similarity to re-rank your search results? For example, if all of the "correct" heatmap pairs are always concentrated around a particular object, and we see a similarity heatmap that has lots of different, small hotspots, then maybe that's an indicator that that's a bad match, even if the magnitude of the similarity is high.

I don't actually have a great intuition about whether there is something systematic in the heatmaps for correct vs incorrect results, but it's a straightforward enough task to train a binary classifier to predict whether a pair of heatmaps are from a the same class or different classes.

I'm currently generating training data pairs from the cars training set. For every query image, I get the 20 closest results in EPSHN output feature space, and generate their similarity map pairs (each pair is 8x8x2), labeled with whether they're from the same class or not. This produced 130,839 same-class pairs and 30,231 different-class pairs. (A better choice might be to grab only results that are within a distance threshold, but the 20 closest results was an easy way of getting similar but not always correct image pairs).

The next goal is to actually train the binary classifier on these, which, given that we're working with tiny inputs will hopefully not take too long to get to see if it passes the sniff test (I'm actually hoping to maybe have better insight by lab meeting time, but tbd....)

Here is the result:

Some details of training as a note:

Res50, Triplet, Large image, from both sensor, (depth, depth, reflection) as channels.

The recall by plot is pretty low as I thought. Since from the all-plot tSNE, it is kind of mass. But I think the plots do go somewhere. When we do tSNE on chosen several plots, some do separated. So they do go somewhere by something. Also there are some noise variables (wind for example) that we doesn't care may affect the apperance of leaves. So I think for this, we need to find a more specific metric to inspect and qualify the model. Maybe something like:

  • Linear dependence between embedding space and ground truth measurement.
  • Cluster distribution and variance.

I'm also trying to train one that the dimension of embedding space is 2. So that we may show the ability of the network directly on 2D space to see wheather there have something interesting.

Plot Meaning Embedding

I'm also building the network to embedding the abstract plot using the images and date. Some question arised when I implement it.

  • Should it be trained with RGB images or depth?
  • Which network structure/ How deep should it use as the image feature extractor?
  • When training it, should the feature extractor be freezed or not?

My initial plan for this is using the RGB since the networks are pretrainied on RGB image. And use 3-4 layers of the res50 without freezing.

During the past week or so I've been studying/reading/trying to implement dropout in a Convolutional Neural Network.

Dropout is a quite simple yet a very powerful regularization technique. It was first officially introduced in this paper, and it essentially involves keeping a neuron active with some probability, or setting it to zero otherwise. In other words, at each training epoch, certain nodes are either dropped out of the net with probability 1-p or kept with probability p. Dropout could also be explained as a mechanism to simply drop a (previously defined) percentage of random values from the training dataset (that is, set their vectors to be 0), only updating the parameters of the sampled network based on the input data. It could be used both for text and image analysis. Dropout, however, is never used on the test dataset. Its main end-goal is to reduce overfitting and therefore achieve greater accuracy.

The paper linked above had a great visualisation of how dropout can operate (see below). The image to the left shows a standard neural network with 2 hidden layers, and the image on the right shows the same network but with certain (random) neurons dropped.


Overall, as we can see from the image below, when training a neural network on the CIFAR-10 dataset and using dropout value 0.75, the accuracy may improve in some cases, depending on the number of epochs. Dropout does help increase the validation accuracy, but not very dramatically. The training accuracy, however, seems to be generally better when using no dropout at all.

I have used dropout in the past when working with text (Keras makes it much easier to use it), and the end result is always very similar. In order to figure out the dropout value that would actually dramatically improve performance and accuracy  it is very important to test out a variety of dropout values and number of epochs. All of those things also highly depend on the subject matter of the dataset and its size, so there is never one universal value. When working with binary text classification problems (e.g. sentiment analysis) though, a lower value of dropout seems to have a tendency to produce better results.


Note: Stanford has removed almost all assignments from the course website as they have restarted it again. Luckily, I had saved some of them, but also did lose access to quite a large portion, hence why I'm still on Assignment 2.

I calculate kl distances of same image pair by pytorch and sklearn code, and compare them. Unfortunately, they are different. So I check the pytorch code, find that the Q in pytorch have a little bug (add 2 instead of 1 in the numerator of Q). After fixing, they get same result now. I don't know how this bug will affect t-sne converge. So, I just re-run experiments. So far, experiments for all data in CUB dataset is done, for training data in CAR dataset is done.

The result is as following:

All of them are based on Npair loss


CAR_training dataset:

CUB_training dataset:

CUB_testing dataset:


And, I tried to visualize kl distance for each point in a tsne map.