This may be a brief post because I'm home with a sick toddler today, but I wanted to detail (1) what I've been working on this week, and (2) something I'm excited about from a conversation at the Danforth Plant Science Center yesterday.
Nearest Neighbor Loss
In terms of what I've been doing since I got back from DC: I've been working on implementing Hong's nearest neighbor loss in TensorFlow. I lost some time because of my own misunderstanding of the thresholding that I want to put into writing here for clarity.
The "big" idea behind nearest neighbor loss is that we don't want to force all of the images in a class to project to the same place (in the hotels in particular, doing this is problematic! We're forcing the network to learn a representation that pushes bedrooms and bathrooms, or rooms from pre/post renovations to the same place!) So instead, we're going to say that we just want each image to be close to one of the other images in its class.
To actually implement this, we create batches with K classes, and N images per class (somewhere around 10 images). Then to calculate the loss, we find the pairwise distance between each feature vector in the batch. This is all the same as what I've been doing previously for batch hard triplet loss, where you average over every possible pair of positive and negative images in the batch, but now instead of doing that, for each image, we select the single most similar positive example, and the most similar negative example.
Hong then has an additional thresholding step that improves training convergence and test accuracy, and which is where I got confused in my implementation. On the negative side (images from different classes), we check to see if the negative examples are already far enough away from each other. If it is, we don't need to keep trying to push it away. So any negative examples below the threshold get ignored. That's easy enough.
On the positive side (images from the same class), I was implementing the typical triplet loss version of the threshold, which says: "if the positive examples are already close enough together, don't worry about continuing to push them together." But that's not the threshold Hong is implementing, and not the one that fits the model of "don't force everything from the same class together". What we actually want is the exact opposite of that: "if the positive examples are already far enough apart, don't waste time pushing them closer together."
I've now fixed this issue, but still have some sort of implementation bug -- as I train, everything is collapsing to a single point in high dimensional space. Debugging conv nets is fun!
I am curious if there's some combination of these thresholds that might be even better -- should we only be worrying about pushing together positive pairs that have similarity (dot products of L2-normalized feature vectors) between .5 and .8 for example?
Detecting Anomalous Data in TERRA
I had a meeting yesterday with Nadia, the project manager for TERRA @ the Danforth Plant Science Center, and she shared with me that one of her priorities going forward is to think about how we can do quality control on the extracted measurements that we're making from the captured data on the field. She also shared that the folks at NCSA have noticed some big swings in extracted measurements per plot from one day to the next -- on the estimated heights, for example, they'll occasionally see swings of 10-20 inches from one day to the next. I don't know much about plants, but apparently that's not normal. 🙂
Now, I don't know exactly why this is happening, but one explanation is that there is noise in the data collected on the field that our (and other's) extractors don't handle well. For example, we know that from one scan to the next, the RGB images may be very over or under exposed, which is difficult for our visual processing pipelines (e.g., canopy cover checking the ratio of dirt:plant pixels) to handle. In order to improve the robustness of our algorithms to these sorts of variations in collected data (and to evaluate if it actually is variations in captured data causing the wild swings in measurements), we need to actually see what those variations look like.
I proposed a possible simple notification pipeline that would notify us of anomalous data and hopefully help us see what data variations our current approaches are not robust to:
- Day 1, plot 1: Extract a measurement for a plot.
- Day 2, plot 1: Extract the same measurement, compare to the previous day.
- If the measurement is more than X% different from the previous day, send a notification/create a log with (1) the difference in measurements, and (2) the images (laser scans? what other data?) from both days.
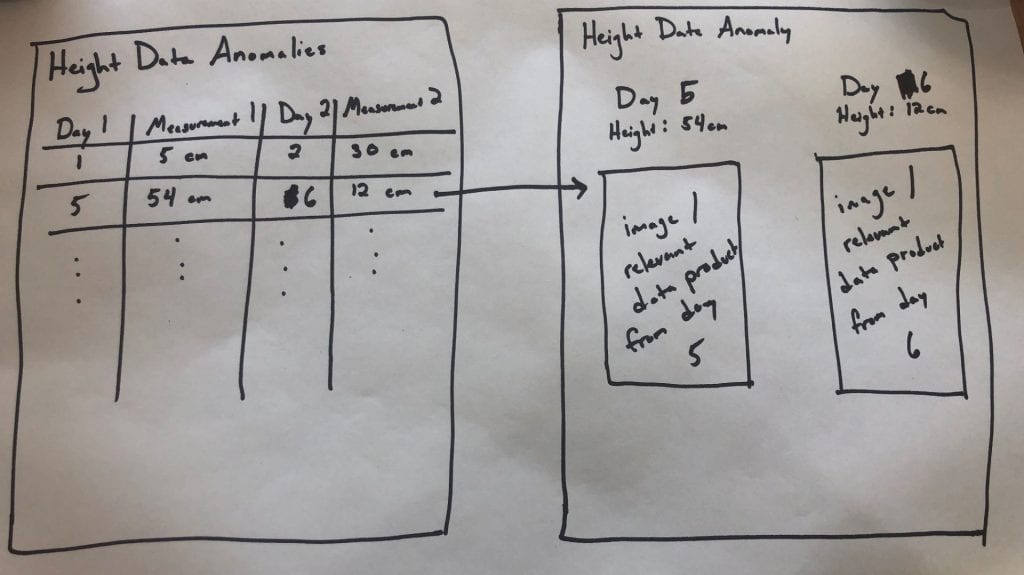
I'd like for us to prototype this on one of our extractors for a season (or part of a season), and would love input on what we think the right extractor to test is. Once we decide that, I'd love to see an interface that looks roughly like the following:
The first page would be a table per measurement type, where each row lists a pair of days whose measurements fall outside of the expected range (these should also include plot info, but I ran out of room in my drawing).
Clicking on one of those rows would then open a new page that would show on one side the info for the first day, and on the other the info for the second day, and then also the images or other relevant data product (maybe just the images to start with, since I'm not sure how we'd render the scans on a page like this....).
This would (1) let us see how often we're making measurements that have big, questionable swings, and (2) let us start figuring out how to adjust our algorithms to be less sensitive to the types of variations in the data that we observe (or make suggestions for how to improve the data capture).
[I guess this didn't end up being a particularly brief post.]


