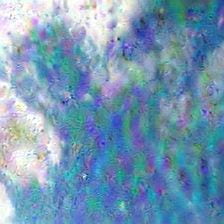
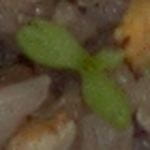
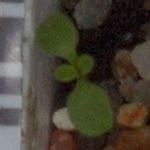
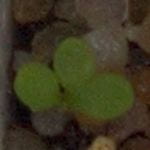
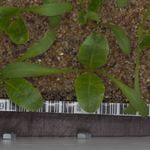
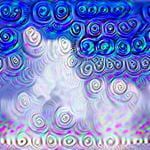
This week, Resnet18 trained on Terra data dreamed with single scale to get rid of the confusion of multi-scaling. (i.e. set the layer of gaussian pyramid = 1 in deep dream algorithm, and feed the network image of size 224x224). Here is the result of using different criterion:
L2 norm criterion: (amplifying large output in all channels within certain layer)
Block 1 Block 2


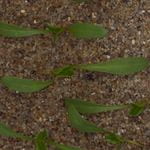
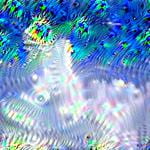
Block 3: Fc layer:


It can be observed that the size of repetitive pattern becomes larger when network goes deeper (because the deeper layer has larger receptive field). And the pattern becomes more complex (because deeper layer undergoes more non-linearity)
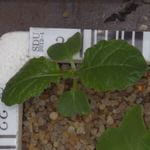
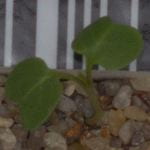
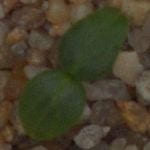
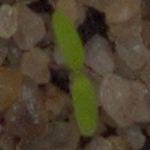
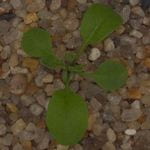
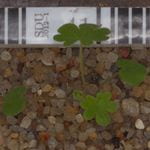
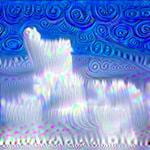
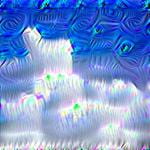
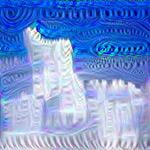
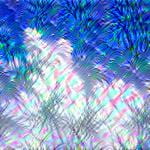
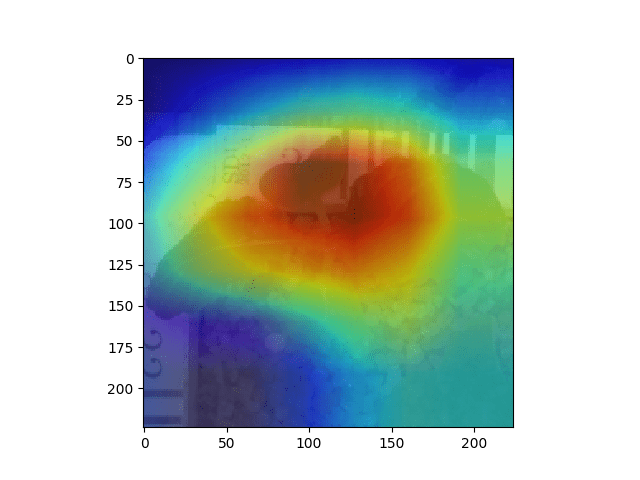
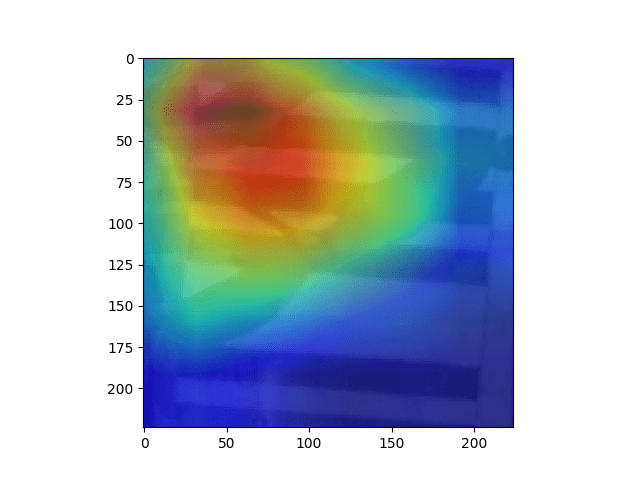
One-hot criterion: (maximizing single neuron in fc layer, each neuron represent a class. class 0, 8, 17 from left to right):


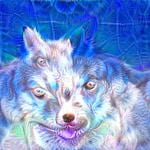
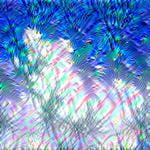
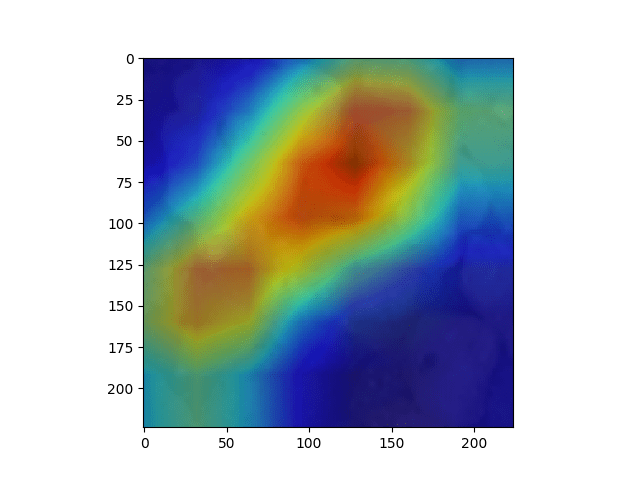
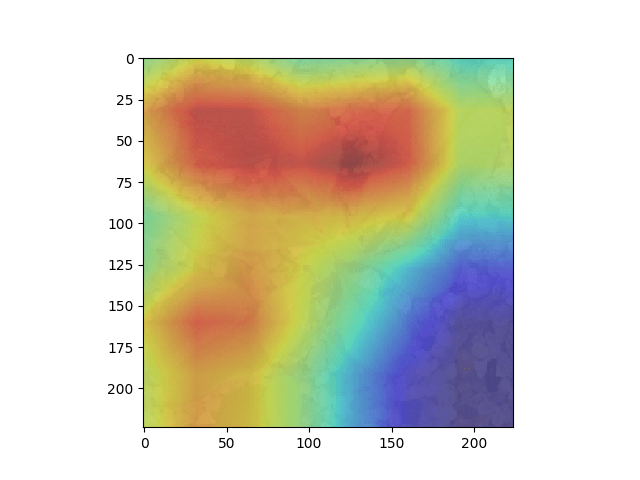
It can be observed that without the confusion of multi-scaling, there is still no recognizable difference between each class. In order to verify the validity of the algorithm, same experiment is done on resent-50 trained on ImageNet:
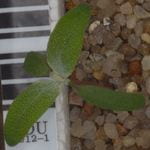
fish (middle): bird (up-right):


long hair dog (bottom-left): husky(middle right):


It is shown that one-hot criterion is capable of revealing what network encodes for different classes. Therefore, It is very likely that class 0, 8 and 17 in the previous figure actually represent different features, but those features lacks semantic meaning and thus hard to be recognized.
One possible reason behind this phenomenon is that terra dataset is relatively monotonic and the differences between each class is subtle. So network do not have to encode semantically meaningful high-level features to achieve good result. Instead, those unrecognizable feature may best represent the data distribution of each class.
The following experiments can be used as next step to verify these hypothesis:
- Mix the data in ImageNet with terra to make the classification harder. It is expected that high level structure such as sorghum will be learned.
- Only include class 0 and class 18 in dataset to make classification easier. The features for each class should have greater difference.
- Visualize the embedding of dream picture and data points. The dream picture should locate at the center of the data points.