We've been playing around with different pooling strategies recently -- what regions to average over when pooling from the final convolutional layer to the pooled layer (which we sometimes use directly in embedding, or which gets passed into a fully connected layer to produce output features). One idea that we were playing with for classification was to use class activation maps to drive the pooling. Class activation maps are a visualization approach that visualize which regions contributed to a particular class.
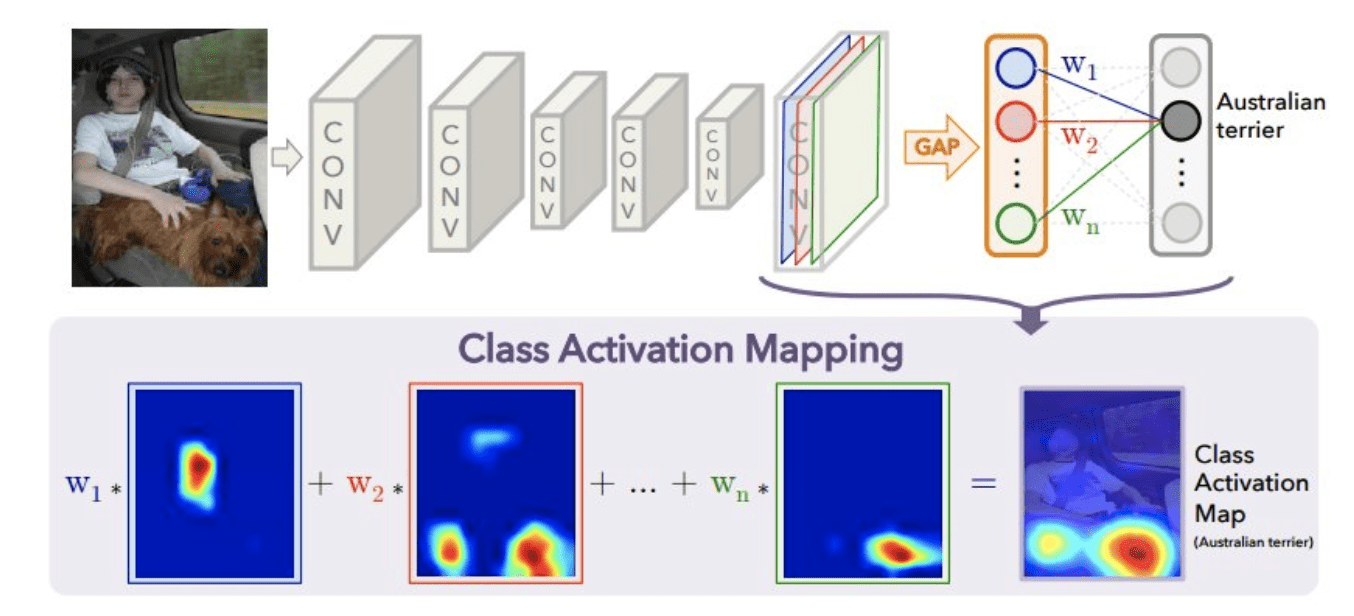 Often we make these visualizations to understand what regions contributed to the predicted class, but you can actually visualize which regions "look" like any of the classes. So for ImageNet, you can produce 1000 different activation maps ('this is the part that looks like a dog', 'this is the part that looks like a table', 'this is the part that looks like a tree').
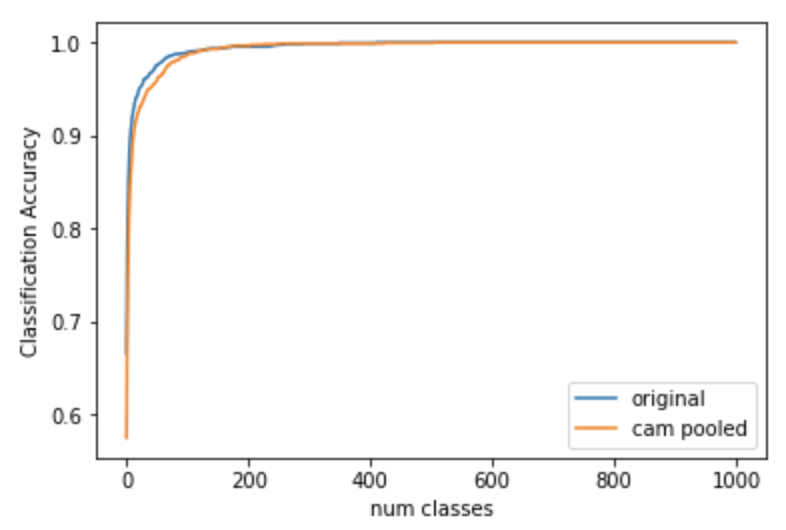
The CAM Pooling idea is to then create 1000 different pooled features, where each filter of the final conv layer is pooled over only the 'active' regions from the CAM for each respective class. Each of those CAM pooled features can then be pushed through the fully connected layer, giving 1000 different 1000 element class probabilities. My current strategy is to then select the classes which have the highest probability over any of the CAM pooled features (a different approach would be to sum over all of the probabilities for each of the 1000 CAM pooled features and sort the classes that way -- I think this approach to how we combine 'votes' for a class together is actually probably very important, and I'm not sure what the right strategy is).
So does this help? So far, not really. It actually hurts a bit, although there are examples where it helps:
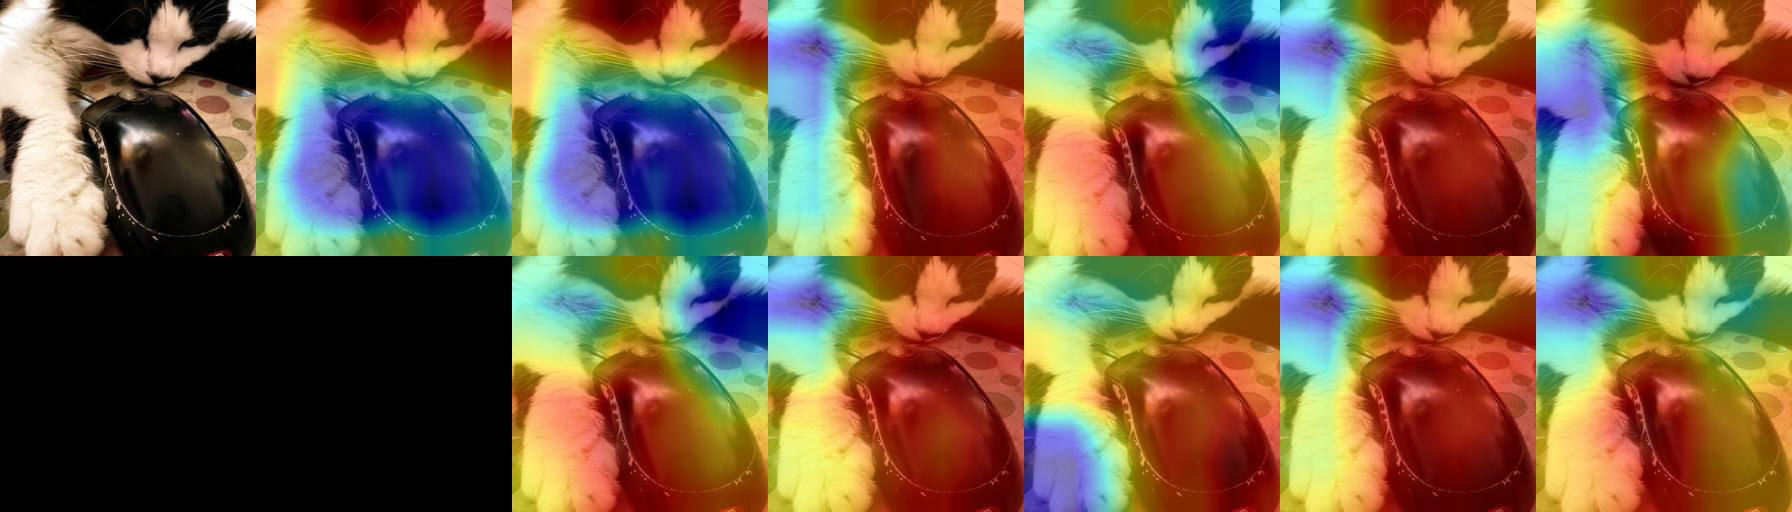
The following pictures show examples where the CAM pooling helped (top) and where it hurt (bottom). (In each case, I'm only considering examples where one of the final results was in the top 5 -- there might be cases where CAM pooling improved from predicting the 950th class to 800th, but those aren't as interesting).
In each picture, the original query image is shown in the top left, then the CAM for the correct class, followed by the top-5 CAMs for the original feature (CAMs for the top 5 predicted class), and then in the bottom row the CAMs for the top-5 CAMs for the classes predicted by the CAM pooled features.

Original index of correct class: 21
CAM Pooling index of correct class: 1
Original index of correct class: 1
CAM Pooling index of correct class: 11
More examples can be seen in: http://zippy.seas.gwu.edu/~astylianou/images/cam_pooling