Leaf length/width
The leaf length width pipeline was completed for season 6 and I got the result on leaf scale. Some statistic summary (mean and percentile) for some random plots:
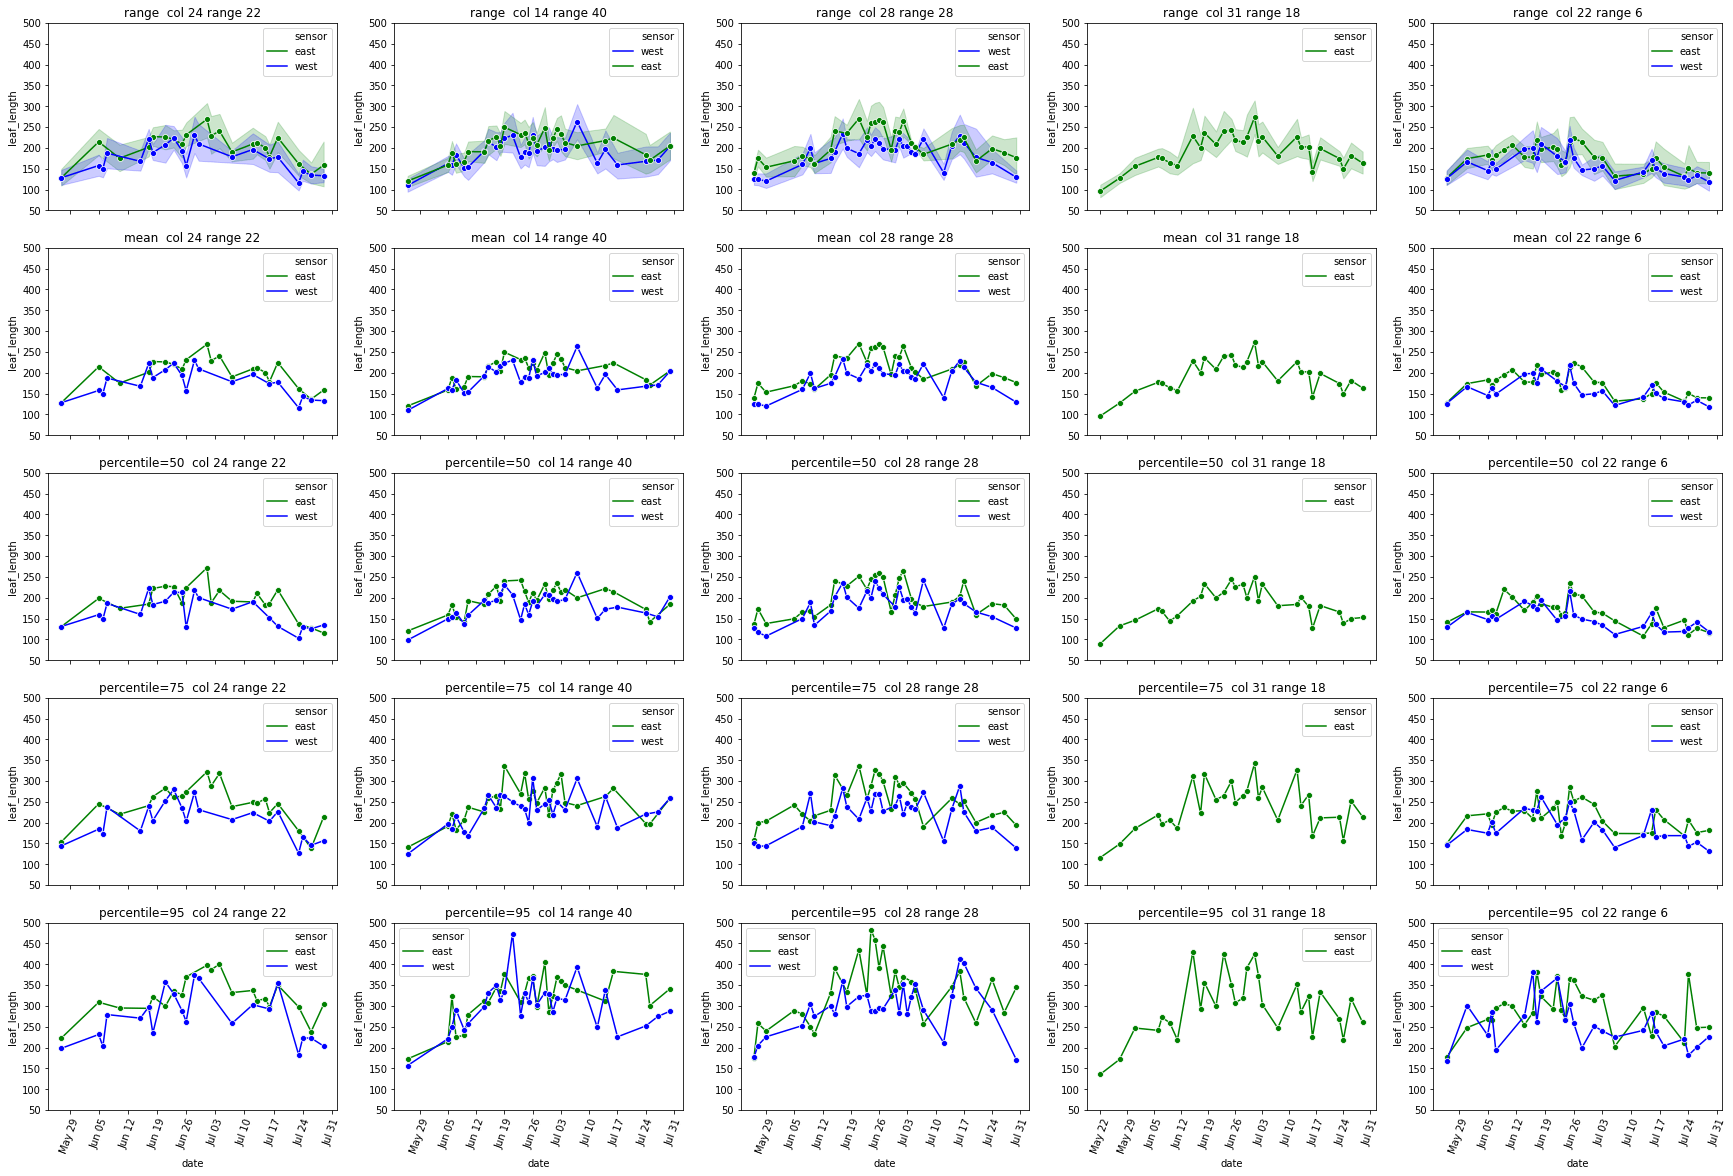
The code I ran for slack post do have a typo. So I regenerate these with more percentiles.
The result at the start of the season seems reasonable, but when it goes to the end of the season, the leaf becomes smaller from the result. The higher percentiles do have some good effect on finding the 'complete leaves'. But it also add more noise sometimes at the early season. And still, it's not working for some days.
So I just randomly cropped 4 image from the late season:
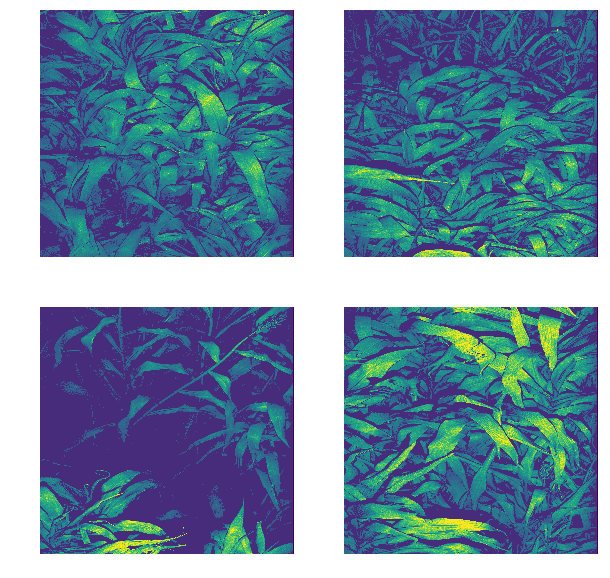
Left top for example, the scanner can only scan one side of the leaves. And most of the leaves are too cureved to see the whole leaves. Which means with the connected component, it is impossible for this kind of situation. To have a better understand of this, I have to debug deeper into the late season. like label all the leaves on the images to see if the algorithm find the proper leaves or not.
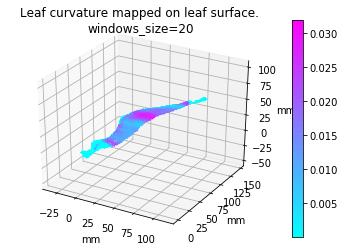
Leaf curvature
I implemented the gaussian curvature and mean curvature. While I was doing so, I found the function I used to find principle curvature last week, is for k_2, not k_1. (The largest eigenvalue is at the end instead of start) Which is the smallest one. So I fixed that and here is the result of gaussian curvature of the leaf in pervious post (also fixed the axis scale issue):
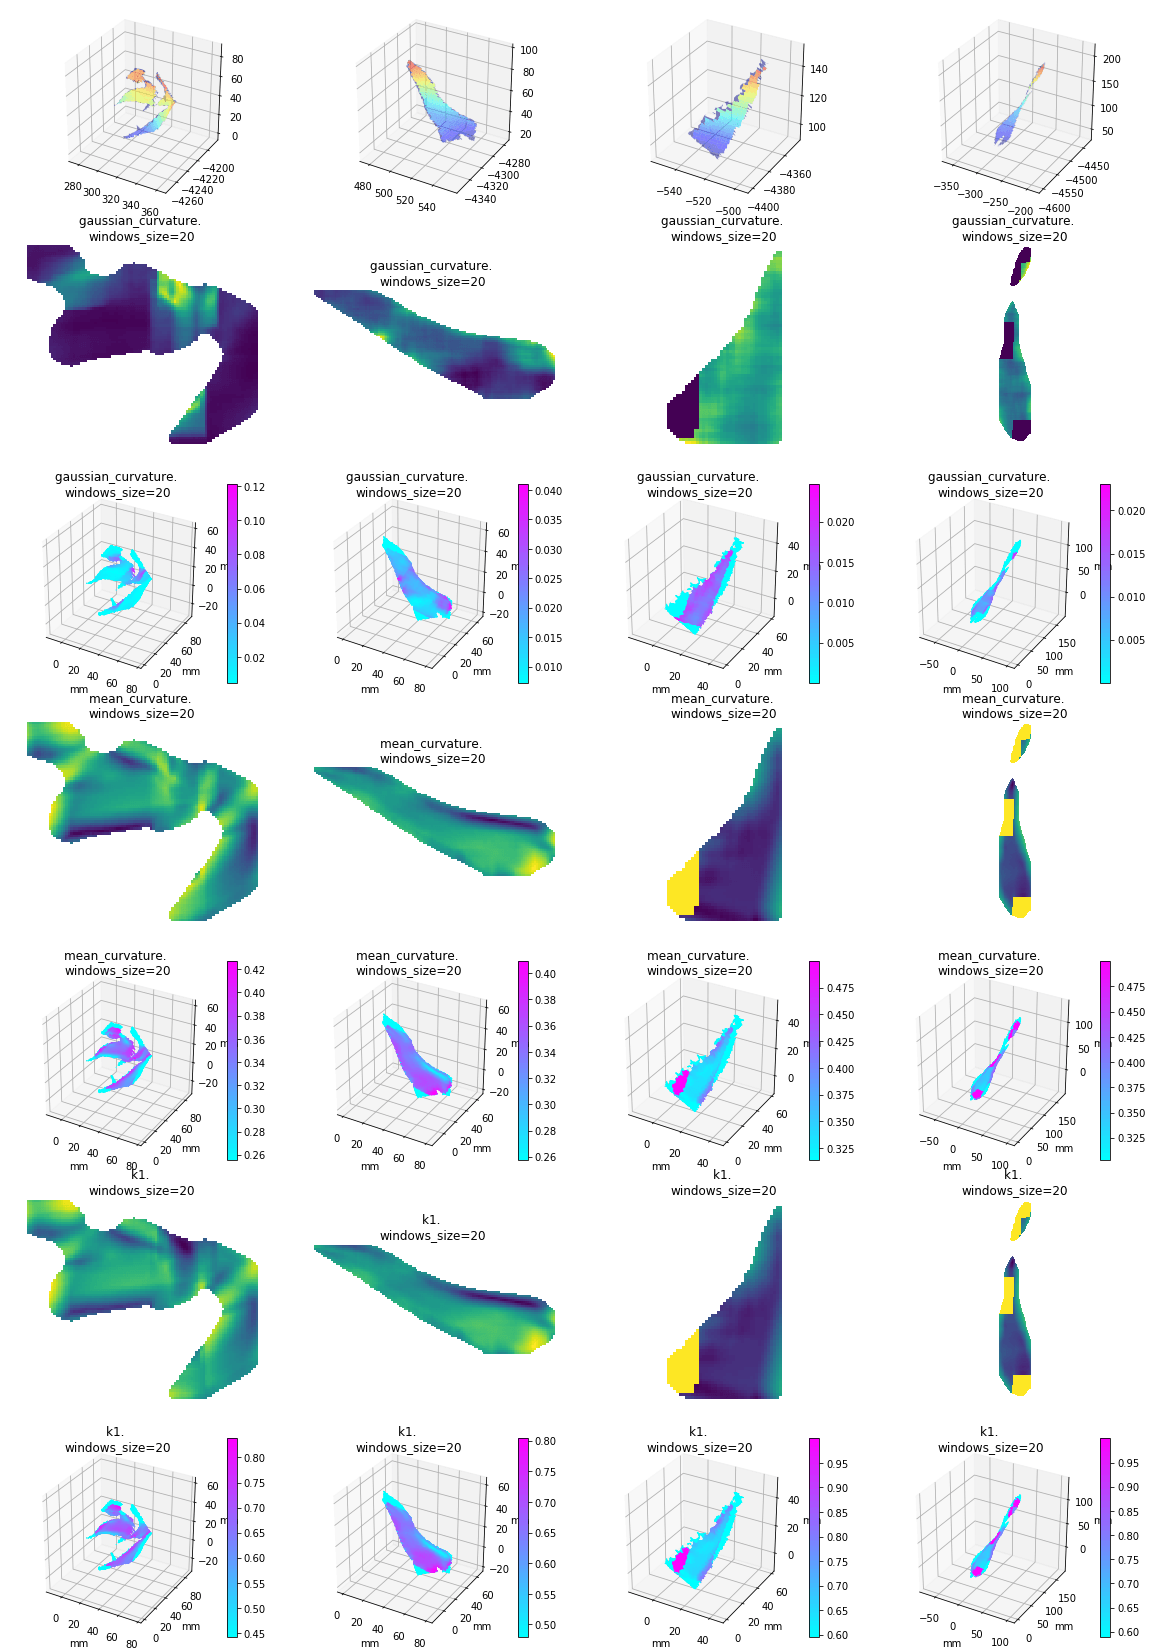
And the comparision among 4 leaves of gaussian mean and k1):
Reverse phenotyping:
I implement the after train stage of the reverse phenotyping as a module since I need to deal with much larger(whole month even whole season) data than before (1-3 days). Then I could easily run them with trained vectors and hand labeled data.
Since I noticed that we have a trained (Npair loss) result of 1 month scans (but never processed for reverse phenotyping), I decide to use that to see what we could get from that (the fatest way to get a result from a larger dataset). Here is some information about the one month data:
- total data points 676025
- hand labeled:
-
canopy_cover 2927 canopy_height 30741 leaf_desiccation_present 26477 leaf_length 1853 leaf_stomatal_conductance 54 leaf_width 1853 panicle_height 145 plant_basal_tiller_number 839 stalk_diameter_major_axis 222 stalk_diameter_minor_axis 222 stand_count 7183 stem_elongated_internodes_number 4656 surface_temperature_leaf 1268
A simple tSNE down sampled to 100000 points:
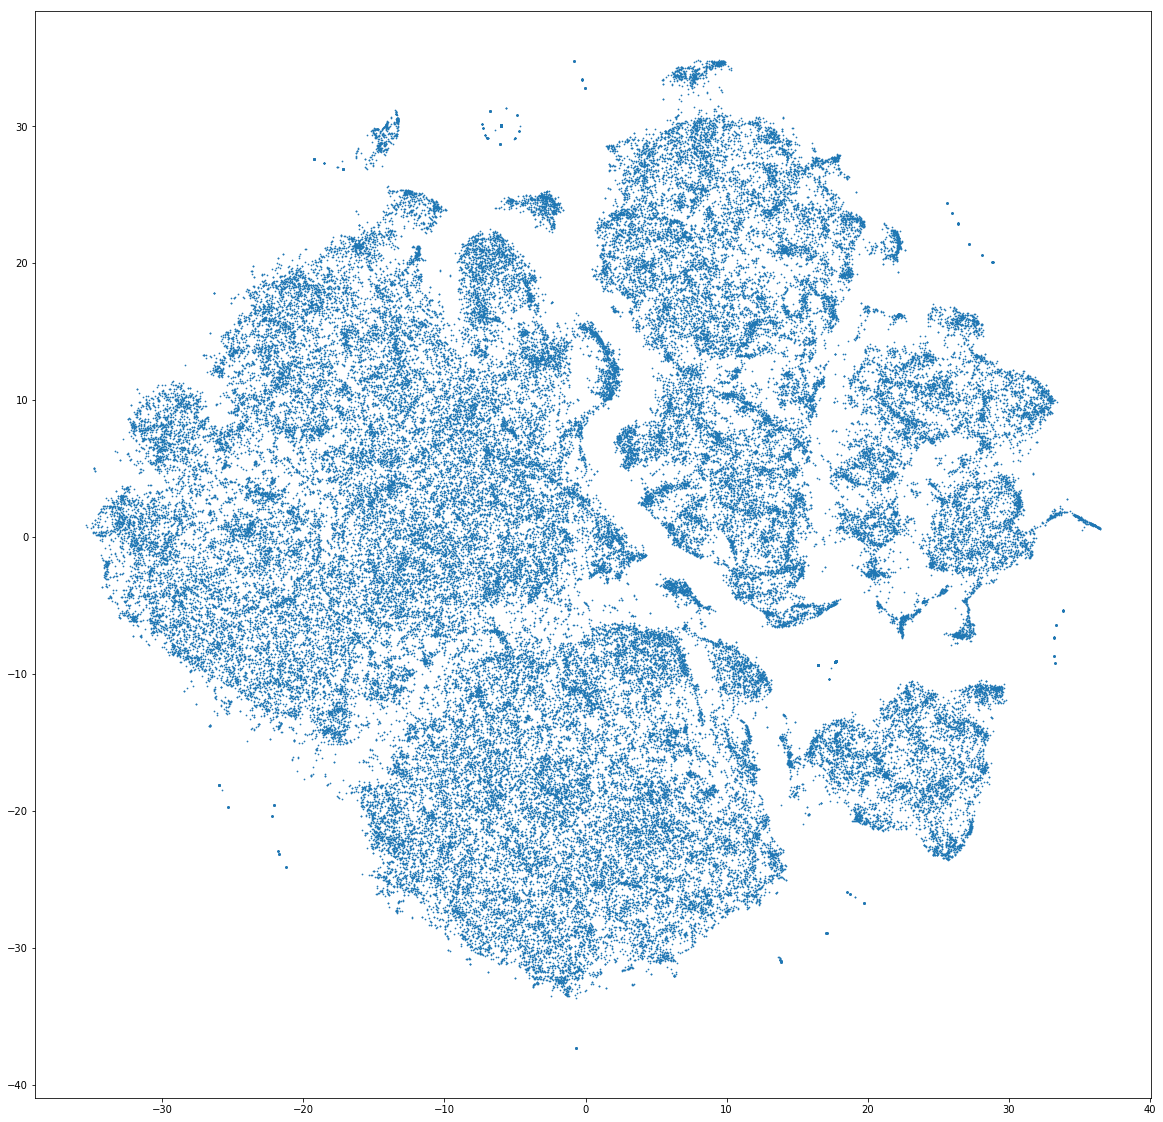
It seems like forming some lines, but it is not converged enough I think.
The live tsne result is on the way!
Holy crap, this should be three different posts. Also, like a comment
I made recently for someone else, the most key part of these posts
should go beyond just "what is the data" to say "what do you think the
data means". I *know* that you may not know the answer to this
entirely, and I *still* want to hear these things. I'll try to
capture some of those ideas in this post.
What should be Post 1: "Leaf Length":
These plots really do look pretty good!
Questions:
1. Do we have ground truth measurements for any of these? How do they
compare? (my guess is that they are quite different but I would love
to be proved wrong).
2. (not a question) I like the analysis that you've done. There is a
trend of the leaves seemingg to get shorter at the end of the season.
You hypothesize that it might be becomes we are not getting good
segmentations because the leaves are much more curled in on each other
than they had been --- and then you show some images that somewhat show this.
Can you show some mid-season images that illustrate why the problem wasn't happening\
then?
Curvature:
(a) You didn't do as good of a job telling us what you think we learned from this?
(b) what are the squarish yellow regions here?
(c) do you believe these plots capture the right things about curvature?
Reverse phenotyping: I love the very very large t-sne; i look forward
to understandding more about that.