I made a visualization of the leaf length/width pipeline for the 3D scanner Data.
Raw data first (part of):
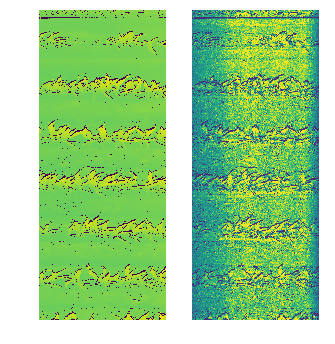
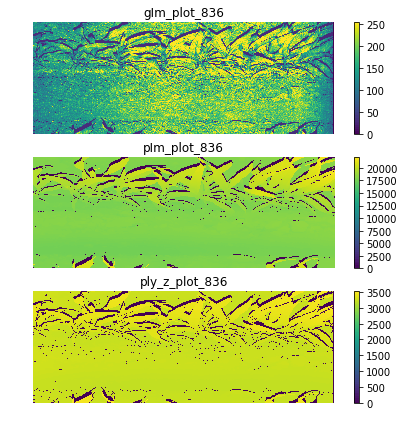
Then is the cropping:
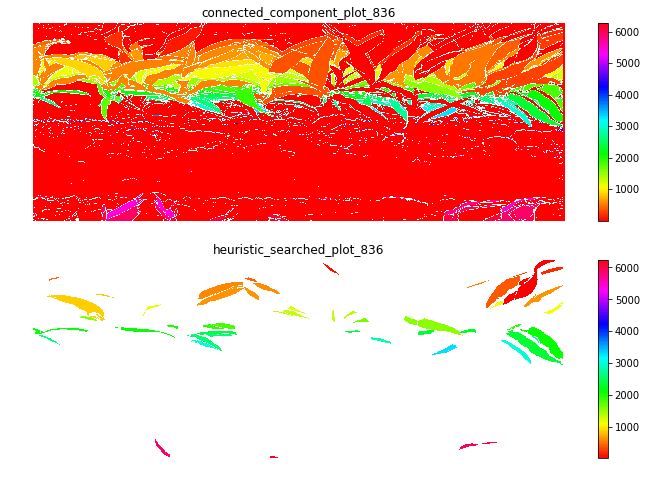
With the connected component, we got 6000+ regions. Then with the heuristic search:
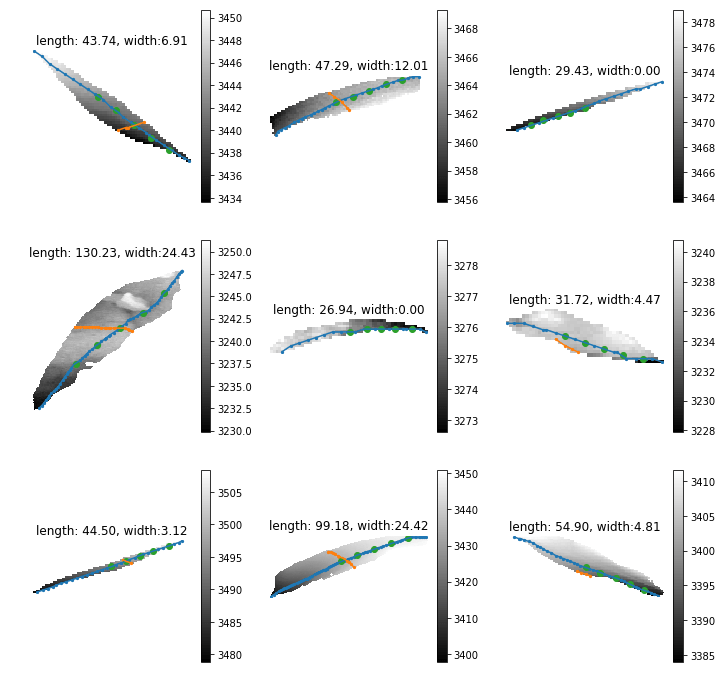
Then is the leaf length and width for each single region. The blue lines are the paths for leaf length, the orange lines are leaf width. The green dots are key points on leaf length path for the leaf width. Those key points are calculated by equally separate the weighted length path as 6 parts. The width with zero means it did not find any good width path
For the leaf width paths that are still on the same side, I'm going to restrict more on the cosine distance instead of only positive cross product: