We want to find the location and surface normals of the hundreds of thousands of specs of glitter on a glitter sheet. With a productive first two weeks of the project, we already have a rig set up for shining light from known locations on a monitor to the glitter square and capturing the sparkles with a fixed camera. We also already have the code that can find glitter specs in images we capture and then find the mean of a Gaussian fit to the brightness distribution over various lighting positions. Now we need to locate all the components precisely in 3D space in the same coordinate system.
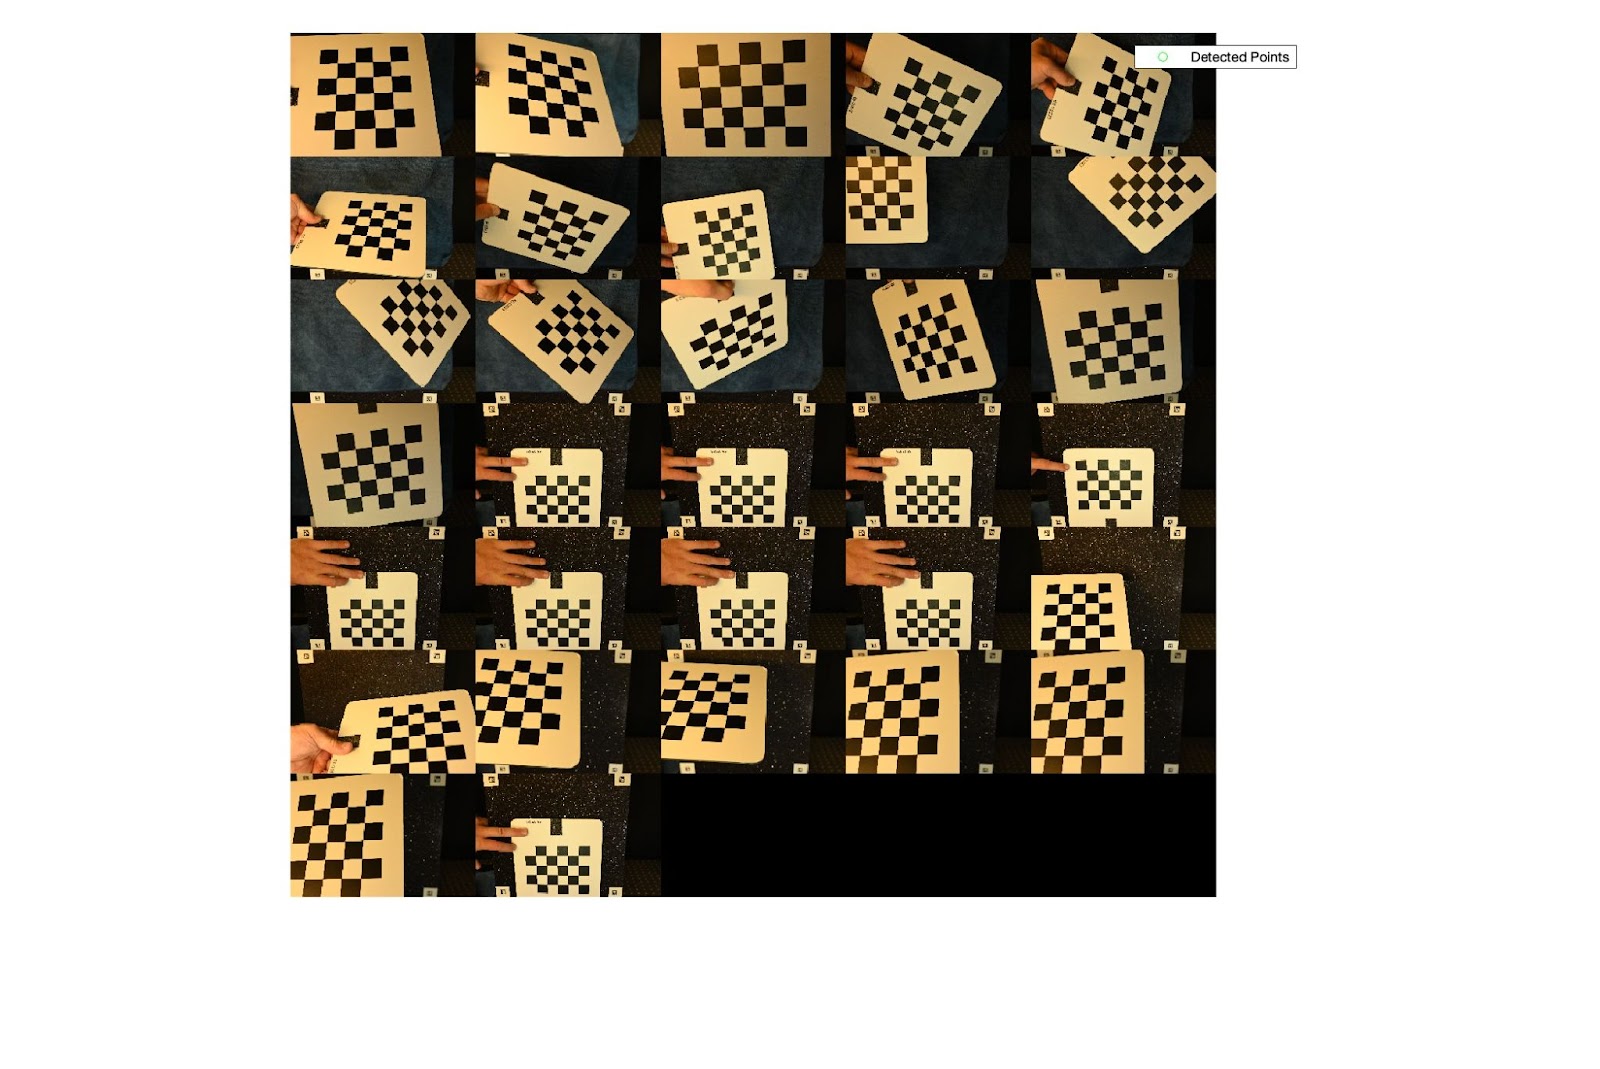
With measurements of the rig already made, we now need to find the location of the camera. This camera calibration requires many images of a known checkerboard pattern held at different locations and angles with respect to the camera. Here is a montage of such images.
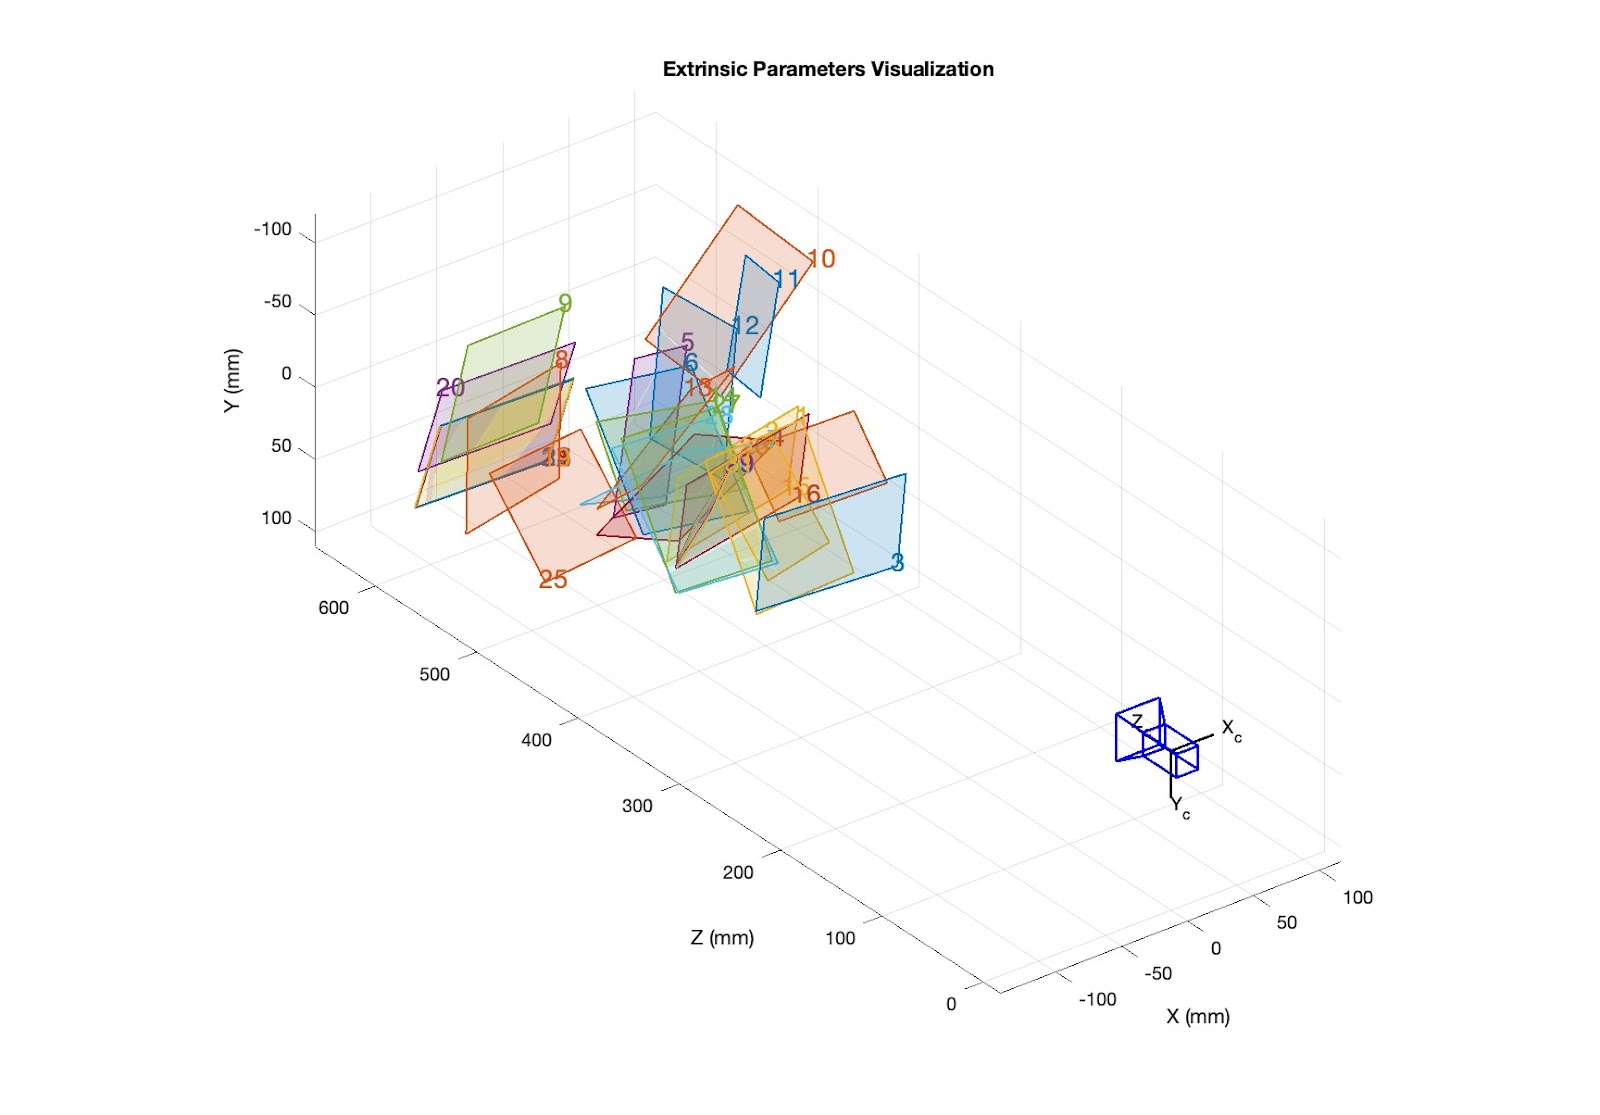
Using these images, we can get a reasonably precise estimate of the camera's location in space. In particular, we find the location of the hypothetical 'pinhole' of the camera, a point from a useful mathematical model of a camera. Here is a visualization of the camera's position relative to all the checkerboards.
Now we know the position of the camera, light, and glitter. The only thing that stands between us and finding the surface normals of all the specs of glitter is some code. A few lines of MATLAB later, here is a diagram of rays of light leaving the (green) monitor, bouncing off the (blue) sheet of glitter, and then hitting the (small blue) pinhole of the camera.

These lines are a sample of the real data. That is to say, for any given spec in this diagram, the light from the monitor is being drawn from the position on the monitor which most illuminates that glitter spec (makes it sparkle the brightest!). (Recall that we found these lighting positions by finding which vertical bar and horizontal bar on the monitor brightened most each spec: the intersection of the bars gives a point on the monitor.) With this information, we can find the surface normals of the glitter specs, assuming they all behave like little flat mirrors. Here is a diagram of some randomly sampled specs' surface normals.

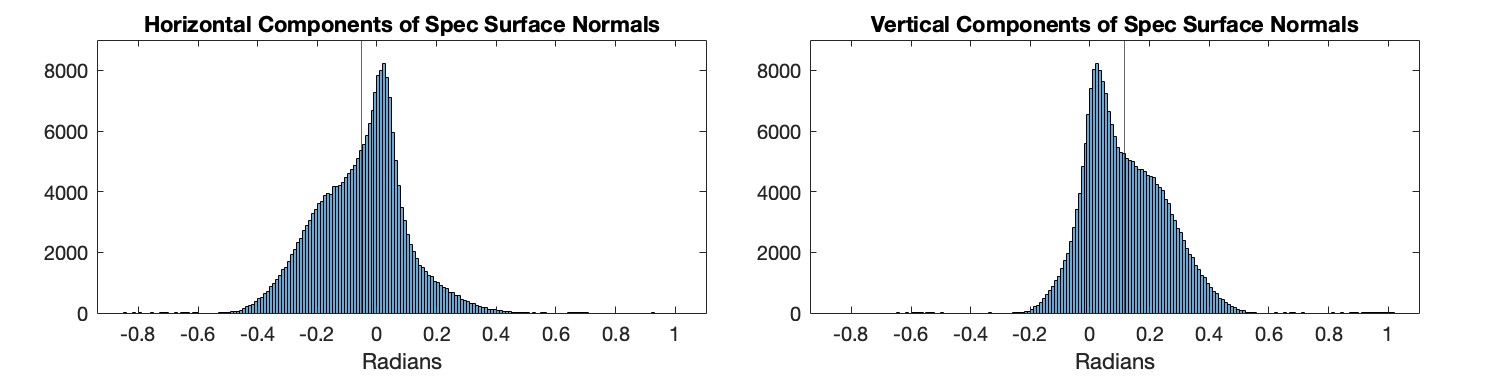
it is reasonable to expect that the surface normals on average point forward, back towards the monitor and camera. That said, we can look closer at their distributions. The horizontal specs tend to point slightly left, and the vertical ones tend to point slightly up. This makes sense, since the camera is positioned slightly left of center, and significantly above the center of the glitter sheet. So, these distributions of surface normal direction reflect not only the true underlying distribution of glitter spec surface normals but also the position of the light sources and camera.
Finally, we can now test our glitter characterization (whether our spec locations and surface normals are accurate) by predicting what an image should look like for a given light/camera position. In this next diagram, the red dot on the monitor corresponds to a small circular light source we displayed on the monitor. We trace the lights path from that light source to the glitter specs, reflect the light on the specs and then trace it back out into the world. A small fraction of those traced rays pass within a few millimeters of the camera position (still the smaller blue dot above the monitor). In this diagram, only those reflect rays which do pass near the camera pinhole are shown.

We can then record which of these specs did in fact reflect the light to the camera and then predict what the resulting image should look like by applying a homography (inverse of the one we used before) to get from the glitter coordinate system back to the image coordinate system. We actually captured an image with a small dot of light on the screen at the position of the red dot in the last diagram, but be warned that our prediction is expected to be awful for a few reasons I'll get into next. But here is (zoomed in) a section of predicted sparkle on the left and captured sparkle on the right.
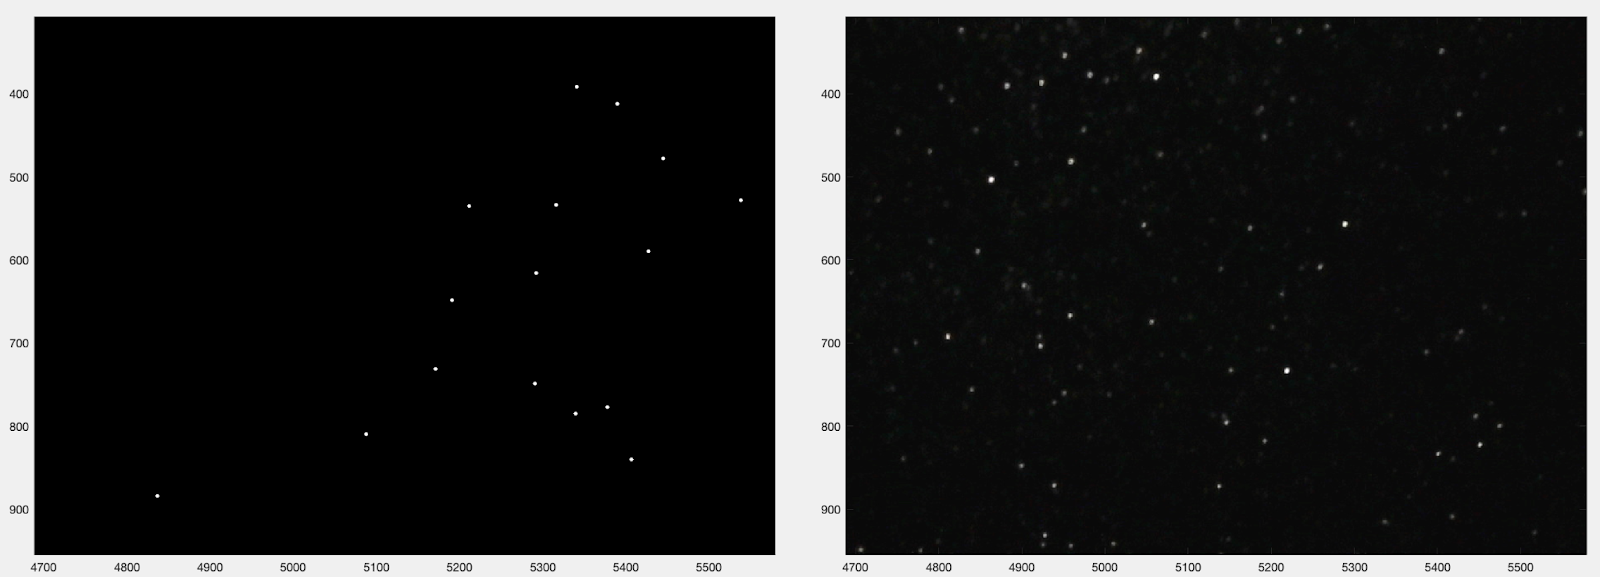
Don't go searching for matching specs. The prediction is wrong.
First off, our characterization suffered from Camera Bump (technical term in the field of glitter study), and this means that all of our surface normals are incorrect. Even a small move in the camera can result in wildly inaccurate sparkle predictions precisely because of the desirable property of glitter, that its appearance is so sensitive to movements and rotations. This said, we now have the code to make predictions about sparkle patterns, which will be useful in future characterizations.
So, at the end of Week 3, we have completed the full glitter characterization pipeline. That is, we can capture set of images of a sheet of glitter and then run code to find the location and surface normal of hundreds of thousands of specs of glitter on the sheet. Now we will get a fresh capture of images (we built a stable camera mount to avoid camera bump from our previous unwieldy plastic tripod), and we will hopefully get some satisfying images showing that our characterization accurately predicts the sparkle pattern of the glitter.
Stay sparkly!
Bloopers: Sometimes, it can take a while to get many measurements and computations to all agree on the same coordinate system, scale, etc...

