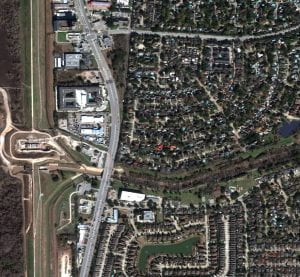
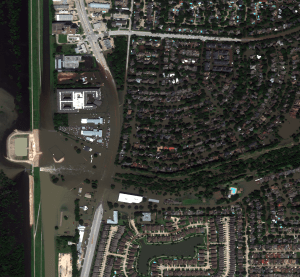
One of the fundamental challenges and requirements for the GCA project is to determine where water is especially when water is flooding into areas where it is not normally present. To this end, I have been studying the flooding in Houston that resulted from hurricane Harvey in 2017. One of the specific areas of interests (AOI) is centered around the Barker flood control station on Buffalo Bayou.
To get an understanding of the severity of the flooding in this area, this is what the Barker flood control station looked like on December 21, 2018...
And this is what the Barker flood control station looked like on August 31, 2017...
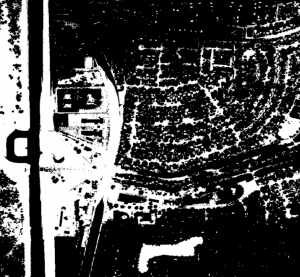
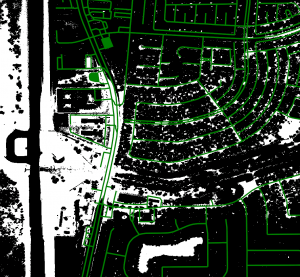
Our project specifically explores how to determine where transportation infrastructure is rendered unusable by flooding. Our first step in the process is to detect where the water is. I have been able to generate a water mask by using the near infrared band available on the satellite that took these overhead photos. This rather simple water detection algorithm produces a water mask that looks like this...
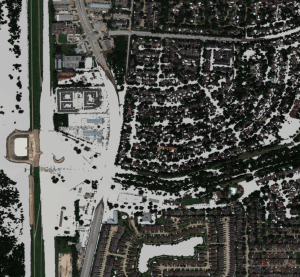
If the mask is overlayed onto the flooded August 31, 2017 image, it suggests that this water detection approach is sufficient for detecting deep water...
There are specific areas of shallow water that are not detected by the algorithm; however, parameter tuning increases the frequency of false positives. There are other approaches that are available to us; however, our particular contribution to the project is not water detection per se and other contributors are working on this problem. Our contribution is instead dependent on water detection, so this algorithm appears to be good enough for the time being. We have already run into some issues with this simplified water detection, namely that trees obscure the sensor which causes water to not be detected in some areas.
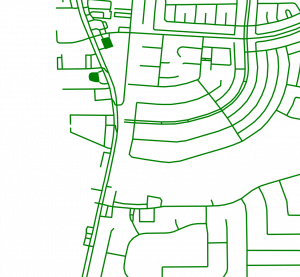
Besides water detection, our contribution also depends on road networks. Again, this is not a chief contribution of our project and others are working on it; however, we require road information to meet our goals. To this end, we used Open Street Maps (OSM) to pull the road information near the Barker Flood Control AOI and to generate a mask of the road network.
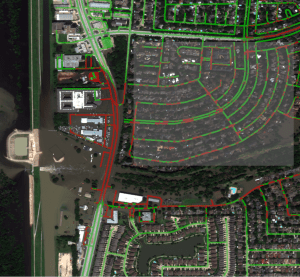
By overlaying the road network onto other imagery, we can start to see the extent of the flooding with respect to road access.
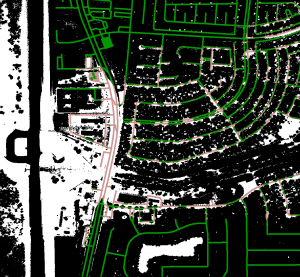
Our contribution looks specifically at road traversability in flooded areas, so by intersecting the water mask generated through a water detection algorithm with the road network, we can determine where water covers the road significantly and we can generate a mask for each of the passable and impassible roads.
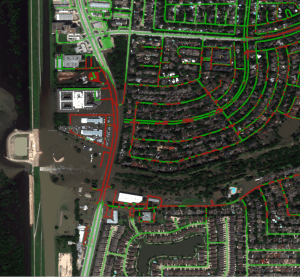
The masks can be combined together and layered over other images of the area to provide a visualization of what roads are traversable.
The big caveat to the above representations is that we are assuming that all roads are passable and we are disqualifying roads that are covered with water. This means that the quality of our classification is heavily dependent on the quality of water detection. You can see many areas that are indicated to be passable that should not be. For example, the shaded box in the following image illustrates where this assumption breaks down...
The highlighted neighborhood in the above example is almost entirely flooded; however, the tree cover in the neighborhood has masked much of the water where it would intersect the road network. There is a lot of false negative information, i.e. water not detected and therefore not intersected, so these roads remain considered traversable while expert analysis of the overhead imagery suggests the opposite.
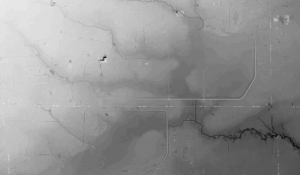
We are also combining our data with Digital Elevation Models (DEM) which are heightmaps of the area which can be derived from a number of different types of sensor. Here is a heightmap from the larger AOI that we are studying derived from the Shuttle Radar Topography Missions (SRTM) conducted late in the NASA shuttle program. This is a sample from the SRTM data of the larger AOI we are studying...
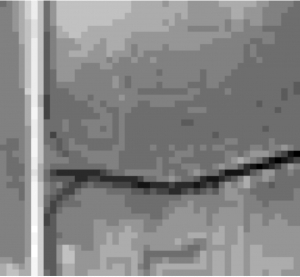
Unfortunately, the devil is in the details and the resolution of the heightmap within the small Barker Flood Control AOI is very bad...
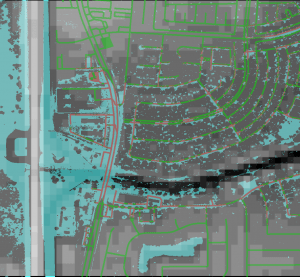
A composite of our data shows that the SRTM data omits certain key features, for example the bridge across Buffalo Bayou is non-existent and that our water detection is insufficient, the dark channel should show a continuous band of water due to the overflow.
The SRTM data is unusable for our next steps, so we are exploring DEM data from a variety of sources. Our goal for the next few days is to assess more of the available and more current DEM data sources and to bring this information into the pipeline.
