As COVID-19 cases and hospitalizations are on the rise in many US states, here are some trusted sources for tracking the situation in the DMV.
Departments of Public Health:
DC Coronavirus Data - Includes daily numbers tested, positives, and lives lost. Scroll down for the DC Re-Opening Tracker and data by ward, neighborhood, and demographic break outs. Tables include data for cases, quarantine and deaths of public safety personnel. Check the Press Releases area on the home page for a detailed daily summary of Coronavirus Data including trends graphs for transmission and positivity rates, and contact tracing data. 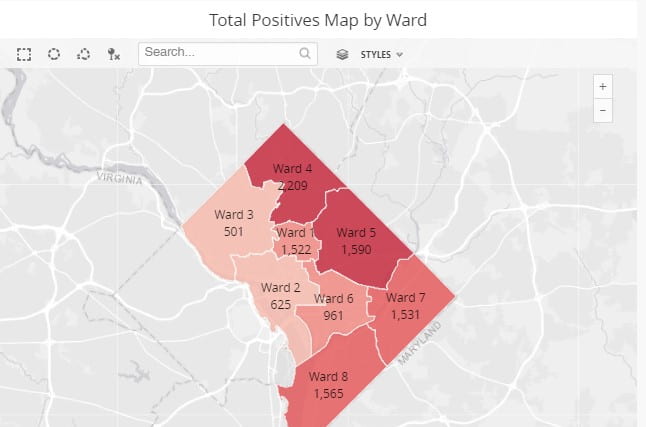
DC Hospital Status Data - Includes daily ICU, ventilator, and bed capacity, COVID hospitalization counts and total patient counts.
Maryland Coronavirus Disease 2019 Outbreak and Data Dashboard - Cases and testing by county, ICU and Acute bed capacities, percentage positive rates and testing volume 7 day averages since March 2020. Cases and deaths by age, gender, race and ethnicity.
Maryland COVID-19 in Congregate Facility Settings (Nursing Homes) - Staff and resident cases and deaths reported by county and facilities.
Virginia Department of Health COVID-19 Dashboard - Includes total counts and graphic representations of cases, hospitalizations and deaths. Demographics tab provides breakouts by age, sex, race and ethnicity. Interactive localities tab provides options for counts or rates, and bar chart generation by health district and locality. Outbreaks tab shows outbreak data by setting/facility type, including long term care and correctional facilities. MIS-C tab tracks cases of Multisymptom Inflammatory Syndrome in Children by health district.
Virginia Department of Health Data Insights - Includes case and testing data by zip code, COVID-like illness visits to EDs by health regions, and modeling data from the UVA COVID-19 Model.
Other Sources:
COVID-19 Watcher (Cincinnati Children's & University of Cincinnati) - Tool merges county-level COVID-19 data from The New York Times with sources from the U.S. Census Bureau, mapping the data by metropolitan area.
COVID Community Vulnerability Map - Drill down into communities by zipcode or manipulate the map to view populations most vulnerable for severe outcomes if infected with a COVID-like virus and the socioeconomic factors driving that risk.
Virginia Hospital COVID-19 Dashboard - Virginia Hospital & Healthcare Association provides counts of confirmed cases and pui currently hospitalized, ICU beds and ventilators in use, and hospitals with supply shortages.
State Health Workforce Estimator - From the Mullan Institute for Health Workforce Equity at GW, it provides state-level data for considering different strategic approaches to ensure sufficient heath workforce for COVID-19. A Contact Tracing Workforce Estimator is also available.
Washington Post Known Coronavirus Deaths and Cases in DC, Maryland and Virginia - Deaths, cases, daily and cumulative counts for each state, daily deaths per 100,000 residents, deaths by county and city, and hospitalizations by state.
Additional monitoring sites, data dashboards and calculators are available on the COVID-19 Research Guide Epidemiology page. The Health Care Resources page includes capacity calculators and models for hospital utilization. Check the Literature, Database, and Data Resources page for open data sets.