A collaborative blog post about collaborative research: a data scientist and a cognitive psychologist combine perspectives.
Alicia Knoedler and David King
In this article, Alicia and Dave combine perspectives to address how the challenges of pursuing grant-funded research are changing and the data-driven ways teams can stay ahead of the dynamic landscape of competitive research.

Dave King and Dr. Alicia Knoedler discussing the Cognitive City platform.
The way that innovative research gets funded is changing.
Dr. Alicia Knoedler: Teams who choose to pursue grant opportunities will need to keep up with the trends if they want to keep dollars supporting their projects. Open access, FAIR data, interdisciplinary collaboration. These are the things that have become more and more important to funders, whose priorities often reflect progressive social change and broad issues like inclusivity and accessibility.
As an example, the National Science Foundation (NSF), provides expectations and measures for successful funding regarding teams:
- Establish the means of developing a coordinated, collaborative approach involving investigators across different institutions and jurisdictions.
- Describe interactions with other groups and organizations among the jurisdictions, and at the national and international levels, as appropriate (NSF EPSCoR Track 2 solicitation)
- Support will be provided for groups of investigators to communicate and coordinate their efforts across disciplinary, organizational, institutional, geographical and/or international boundaries. (NSF Research Coordination Network (RCN) solicitation)
- Team Formation: Successful teams are interdependent, multidisciplinary, and diverse and can work and communicate effectively even when geographically dispersed. Team formation includes strategies to overcome barriers to effective, collaborative teaming, including the integration of members with different areas of expertise, different vocabularies and core values and ways of approaching problems, different understanding of the problems to be addressed, different values, and different working styles. (NSF Gen-4 Engineering Research Centers (ERC) solicitation)
An org chart, really?
The exemplar solicitations above are challenging convention and attempting to expand the capabilities and expectations for research teams. But some of the requirements in these solicitations remain conventional. It is time for a change; not only in imagining how to visually represent teams but moving beyond visual relational images to technology platforms that serve to support the teams’ behaviors, dynamics, decision-making, collaborative work, and their potential to innovate together.
The solicitation specifies that a successful proposal will delineate:
- The overall management and reporting structure of the ERC.
- Which personnel or groups will be responsible for Research, Engineering Workforce Development, Diversity and Culture of Inclusion, and the Innovation Ecosystem. Please explain the relevant experience and expertise of these individuals and how they fit their assigned roles. These individuals should be included in the leadership team.
- An organizational chart, including advisory boards and the reporting/feedback loops involved.
Visualizing these types of teams

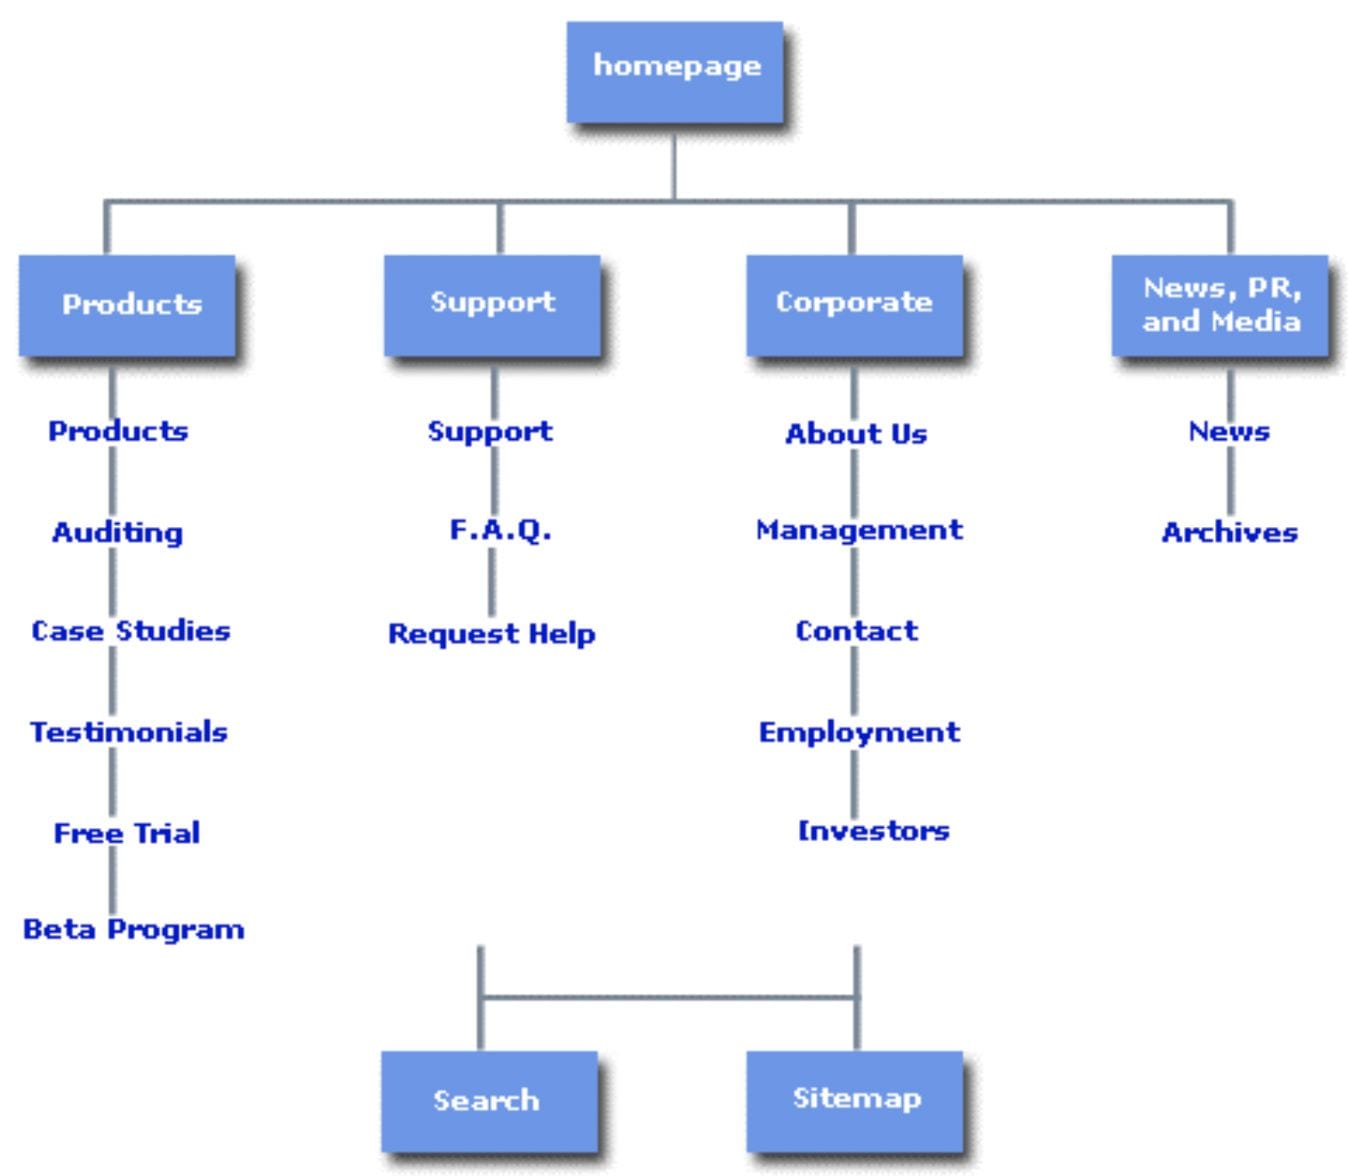
Dave King: The idea of printing out a website is laughable because a website is, well, a web. It’s a set of interconnected content that can be navigated in a multitude of different ways from a multitude of different directions. It’s not a tree. Sure, you can try to make it look like a tree by creating a “site map” like the image below:
There is some utility in being able to look at a website like that, because it helps you understand how a website is built. But it doesn’t really capture at all how a website is used. If you visualize the traffic through the different pages of a website, you don’t get a hierarchical tree, you get something like this:
The difference between those two visualizations and what they represent, how something is built vs. how it behaves, encapsulates exactly the problem with trying to convey the innovative trans-disciplinary nature of your research team through an org chart. The org chart might show how the team was built, but it doesn’t provide any insight into how the team will behave.

Technology can help!
The good news is that when it comes to building networks, and visualizing them, technology can really help. There are an increasing number of tools for network visualization. Many of these tools are for technical developers, but the barrier to entry is getting lower and lower as it is becoming increasingly recognized that non-programmers have reasons to visualize networks too. It is now fairly easy to take an excel file and transform it into a network. For example, I made a spreadsheet of the two-person team comprised of me and Alicia, and some of our expertise and focus areas:
![]()
Then I used an Exaptive “xap” to turn it into this network (pronounced zap, a xap is what we call an app built in Exaptive’s data application developer platform):

(If you’d like to use this application yourself to experiment with visualizing your own team, email Exaptive to request access to the free tool.)
Not all team networks are structured the same way.
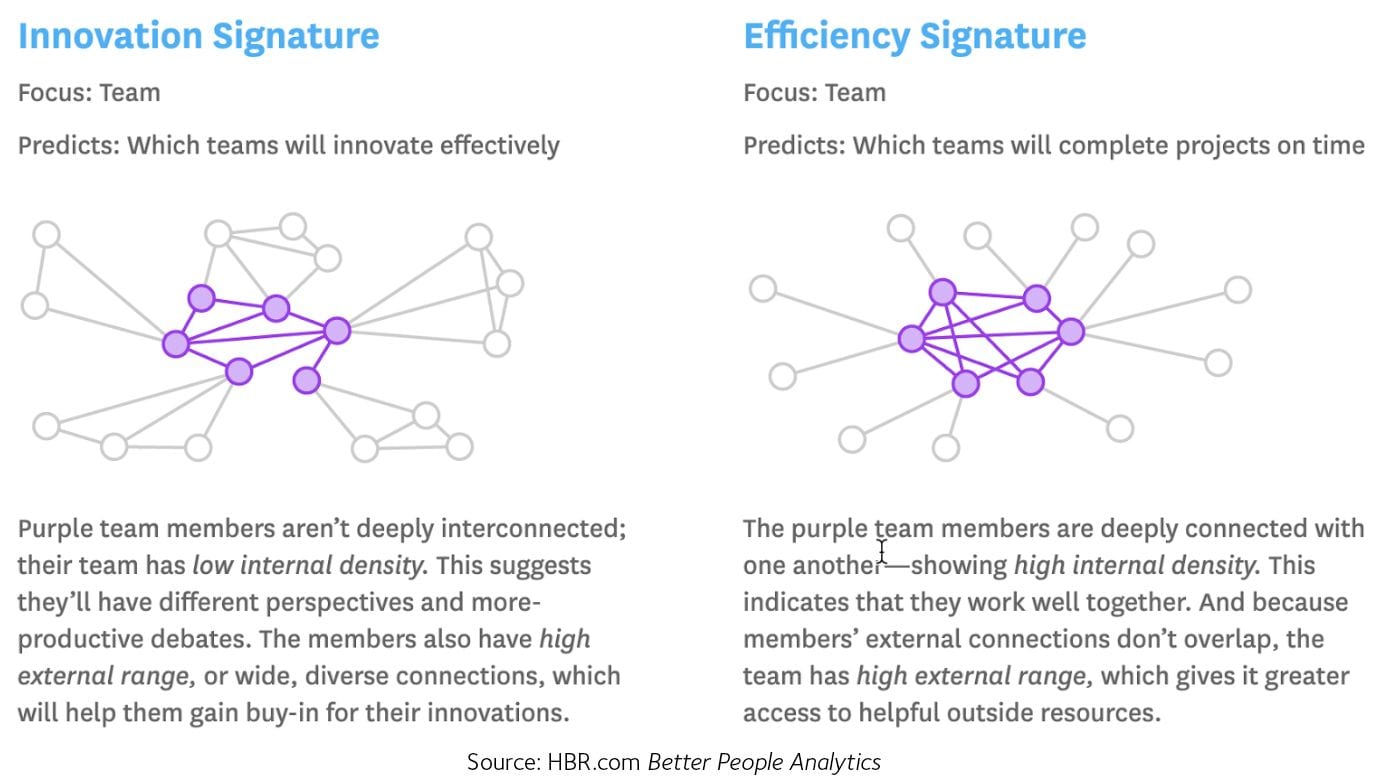
Once you start looking at teams from a network perspective, you open up new opportunities for characterizing teams. In the Harvard Business Review article “Better People Analytics”, Paul Leonardi and Noshir Contractor look at how different team network structures may offer different advantages for different situations, developing a set of team “signatures”. The figure shows two signatures covered in the article, one better for innovation, one better for getting projects done on time!
These signatures are important because they open the door for us to be able to do more than just visualize teams – they allow us to start to quantify some metrics of team performance.
Where do we go from here?
Dr. Alicia Knoedler: We started this conversation by suggesting that providing more insightful visualizations for research teams is among the many opportunities for innovation in research programs. The technology is readily available and becoming easier to utilize. Dave and I are both excited by the prospect provided by technology to team facilitators to enhance their powers of observing, noticing, and catalyzing behaviors within research teams. But we also want to promote these ideas within funding agencies, research team sponsors, and to the reviewers who evaluate proposals. There is opportunity to open up requirements within funding programs for new ways to show team compositions, illuminating team structures and functions, the dynamics and roles of team members, and the proposed behaviors that will lead to competitive research outcomes.
We know that investigators submitting proposals for research funding know to follow the solicitation instructions to the letter. But if the solicitations are requiring conventional, traditional information for team descriptions, it is difficult for research teams to propose something really new. We think the accessibility of these new tools and technologies and will inspire others to push beyond the conventional approaches to suggest that visualizing research teams can be just as innovative as the research they are proposing.
How have you or your team adapted to the trends in collaborative research? Have you found a go-to solution for conveying the strength of a team to funders that you’re willing to share? Please, leave a comment below.
This original version of this article was published on the Exaptive company blog, and can be found here.
Across an 18-year career in research leadership and development, Dr. Alicia J. Knoedler supports and encourages researchers to lead paths of growth and expansion of their research programs, diversify research funding, and seek new research directions and partnerships. A graduate of Purdue University with a PhD in Cognitive Psychology, Dr. Knoedler specializes in crafting, leading and implementing initiatives of strategic value to research and research teams across all disciplines and a diverse range of research organizations. You can find her on LinkedIn at https://www.linkedin.com/in/alicia-j-knoedler-14889a7/

Dave is Founder and CEO of Exaptive. He is an engineer and software architect, whose enthusiasms lie in using data and code to solve problems, communicate ideas, and facilitate innovation, whatever the subject matter. He has been involved in high-tech entrepreneurship since training at MIT in 1993 and has designed and developed award-winning enterprise software for leveraging data. Dave speaks internationally about data science, data-driven software, modular design, and how they facilitate aha moments. He is also a published author and photographer.