Introduction
The science teacher education community continues to advocate for the design of content courses that offer all science majors, but particularly future science teachers, opportunities to engage in scientific inquiry. If future science teachers are to listen closely to students’ ideas, engage students in active knowledge construction, and support disciplinary practices of science, then teacher candidates must experience this kind of learning for themselves. Experiences doing science can occur at multiple points along a teacher candidate's education: during their undergraduate science courses, through mentored research experiences, and, as we show here, also in their science pedagogy courses.
This case of doing science occurred during a science teaching methods course as part of The George Washington University's M.Ed. in Secondary Education program. The course was co-taught by a Science Education-Physics faculty member and a Biology faculty member, and six teacher candidates (3 biology, 1 chemistry, 1 physics) participated in the course.
Our doing science began with the opening question:
How do you think movement affects blood pressure and heart rate, and what's your logic?
Following our initial discussion of this question, teacher candidates completed a series of planned and spontaneous discussions, activities, and reflections over the period of approximately 20 hours. The small subset of video clips and artifacts available here serve to illustrate the range of ideas and models that teacher candidates generated about the opening question, the "aha" moments and challenges encountered as we tried to reach a consensus model, and thoughts about future efforts to include doing science as part of science teacher education.
Designing the Opening Question
The co-instructors for the science methods course, Dr. T (Science Education-Physics) and Dr. H (Biology), brainstormed multiple possible opening questions for this case of doing science. We used four criteria to test the quality of our opening questions:
- Is the question generative?
- Does the question lend itself to modelling?
- Does the question resonate with the Next Generation Science Standards?
- Do we have resources for sustained inquiry on this question?
For each possible opening question, we anticipated ideas and experiences that teacher candidates might have in response to the question. If we could only think of a few possible ideas, the question was rejected. An example of a question that was rejected for not being generative enough was "Why do we need to breathe?"
Because we hoped to give teacher candidates experience in building and refining models, we needed an opening question that would open up opportunities for modelling. All of our brainstormed questions passed this test.
In brainstorming opening questions, we checked the NGSS standards to see if the content of the question aligned with the disciplinary core ideas (DCIs) that our teacher candidates will be expected to teach in their future middle or high school classrooms. All of our questions addressed an NGSS DCI, but because we were working with teacher candidates from biology, chemistry and physics, we rejected opening questions that were too narrowly focused on one content area.
Finally, some questions were generative and supported modelling, but we lacked tools or resources for students to collect data which could serve as the basis for building and refining their models over time. An example of a question that was rejected due to lack of resources was, "Earth is said to be in it’s 6th mass extinction. How do we know and why does it matter?"
The final opening question that we designed grew out of a conversation with teacher candidates about a videotaped lesson on the circulatory system from the TIMSS video data set. The teacher candidates described the lesson as too didactic, but struggled to come up with an alternative way of structuring the lesson when Dr. H prompted them to do so. So, we (Dr. T and Dr. H) decided to model a different approach to the circulatory system by starting with an opening question that asked how movement affects blood pressure and heart rate. The HR/BP question met all of our criteria for a good opening question: it generated many different ideas and lines of inquiry; it created opportunities for modelling and mechanistic reasoning (Russ, Scherr, Hammer & Mikeska, 2008); it resonated the Next Generation Science Standards for 7th-12th grade in biology, chemistry, and physics (see HS-LS-3); and we had resources available to support sustained engagement in the question.
Getting Started
Doing science began with the reading of the opening question, shown in the video clip Getting Started below. As you watch the clip, consider:
- What reactions does the opening question elicit from the teacher candidates? What do these reactions tell us about teacher candidates' expectations for the "doing science" component of the class?
Considering Initial Ideas
After five minutes of individual think time, Student 5 offered her ideas up for consideration by the group. She treated the opening question as two separate questions: How does movement affect heart rate? How does movement affect blood pressure? And, her response took the form of a series of graphs:


Student 5's idea that the body's need for oxygen drives an increase in heart rate during movement seemed to make sense to the group and did not spark strong reactions:
But, when Student 5 suggested that movement has no effect on blood pressure, the group engaged. As you watch the clip below, consider:
- What is Student 5's reasoning for movement not affecting blood pressure?
- What troubles Student 3 about Student 5's idea?
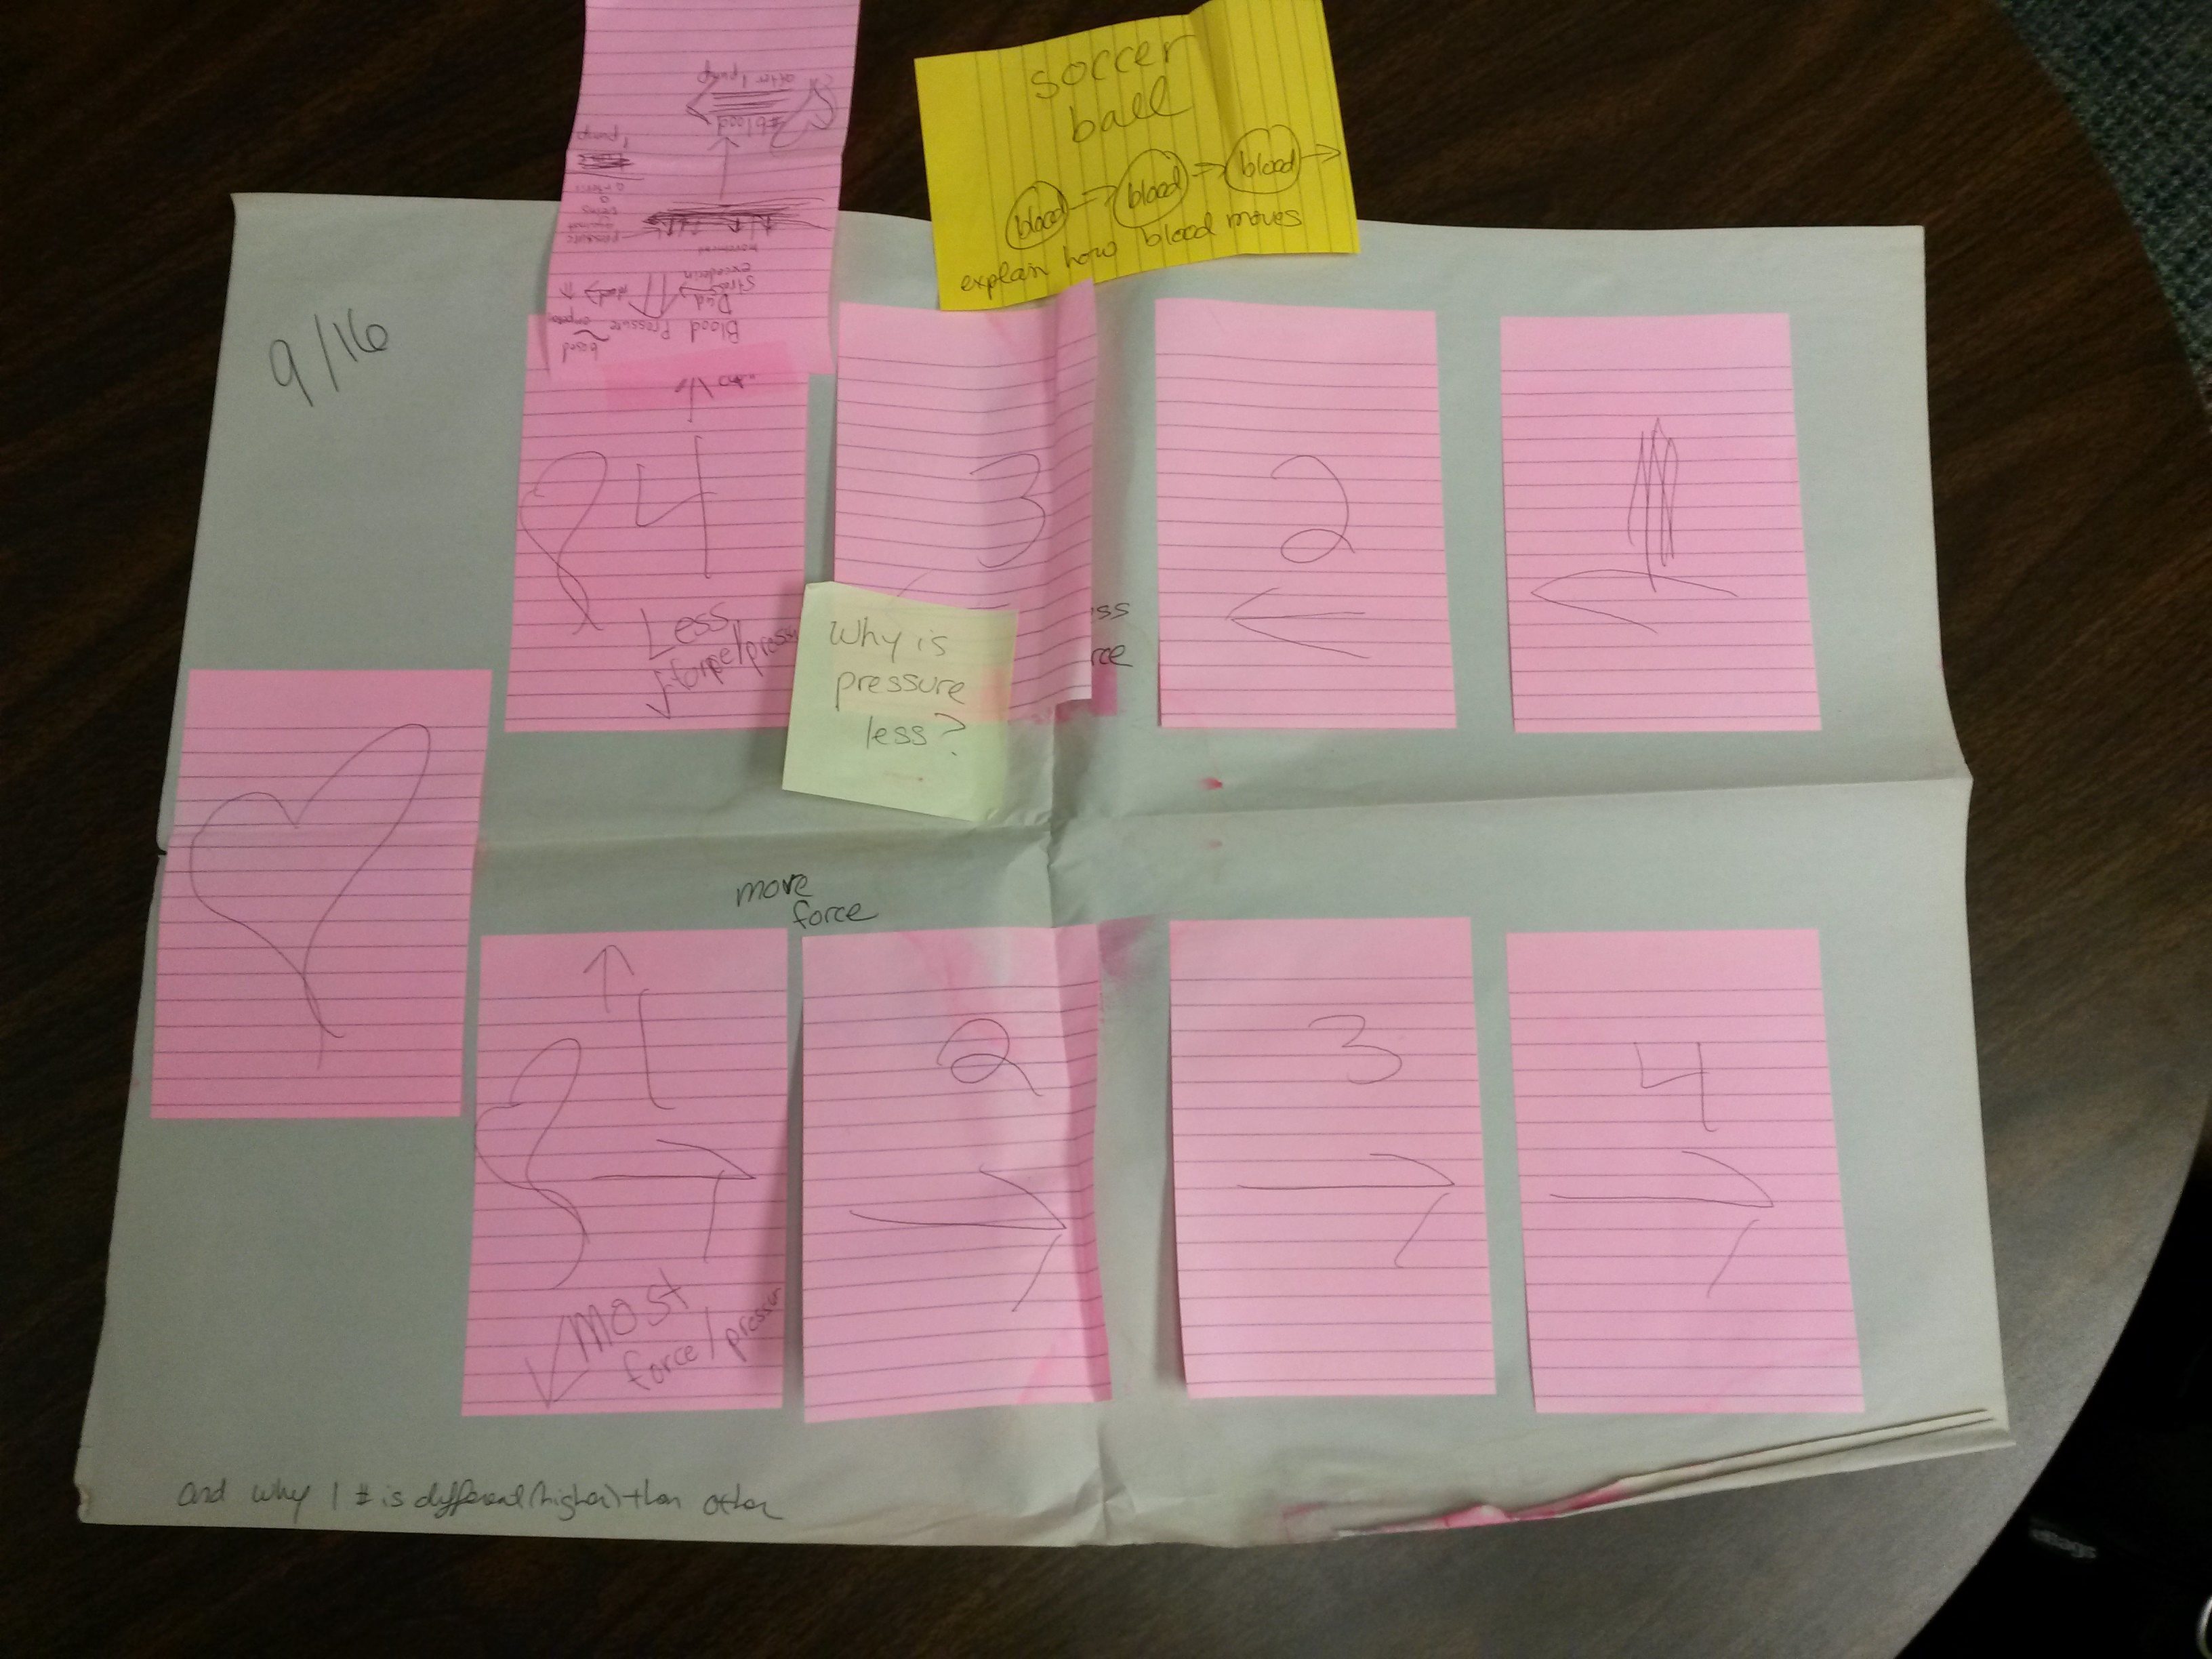
Multiple Models Emerge
Following further discussion of Student 5's idea, we brainstormed different kinds of movement, such as climbing stairs, running, and walking, that could impact heart rate. In a preliminary test of Student 5's idea that need for oxygen increases heart rate, Dr. T held her breath and monitored her pulse using heart rate apps downloaded onto a cell phone. We expected her heart rate to increase, but instead it stayed the same and we were not sure what to make of the results. (Unfortunately, this spontaneous experiment was not caught on video.) Also during this first session of doing science, we began to realize that we were not entirely sure what blood pressure is and what it means for blood pressure to increase or decrease.
To start the next session of doing science, we made individual lists of things we think we know about blood pressure, for example:
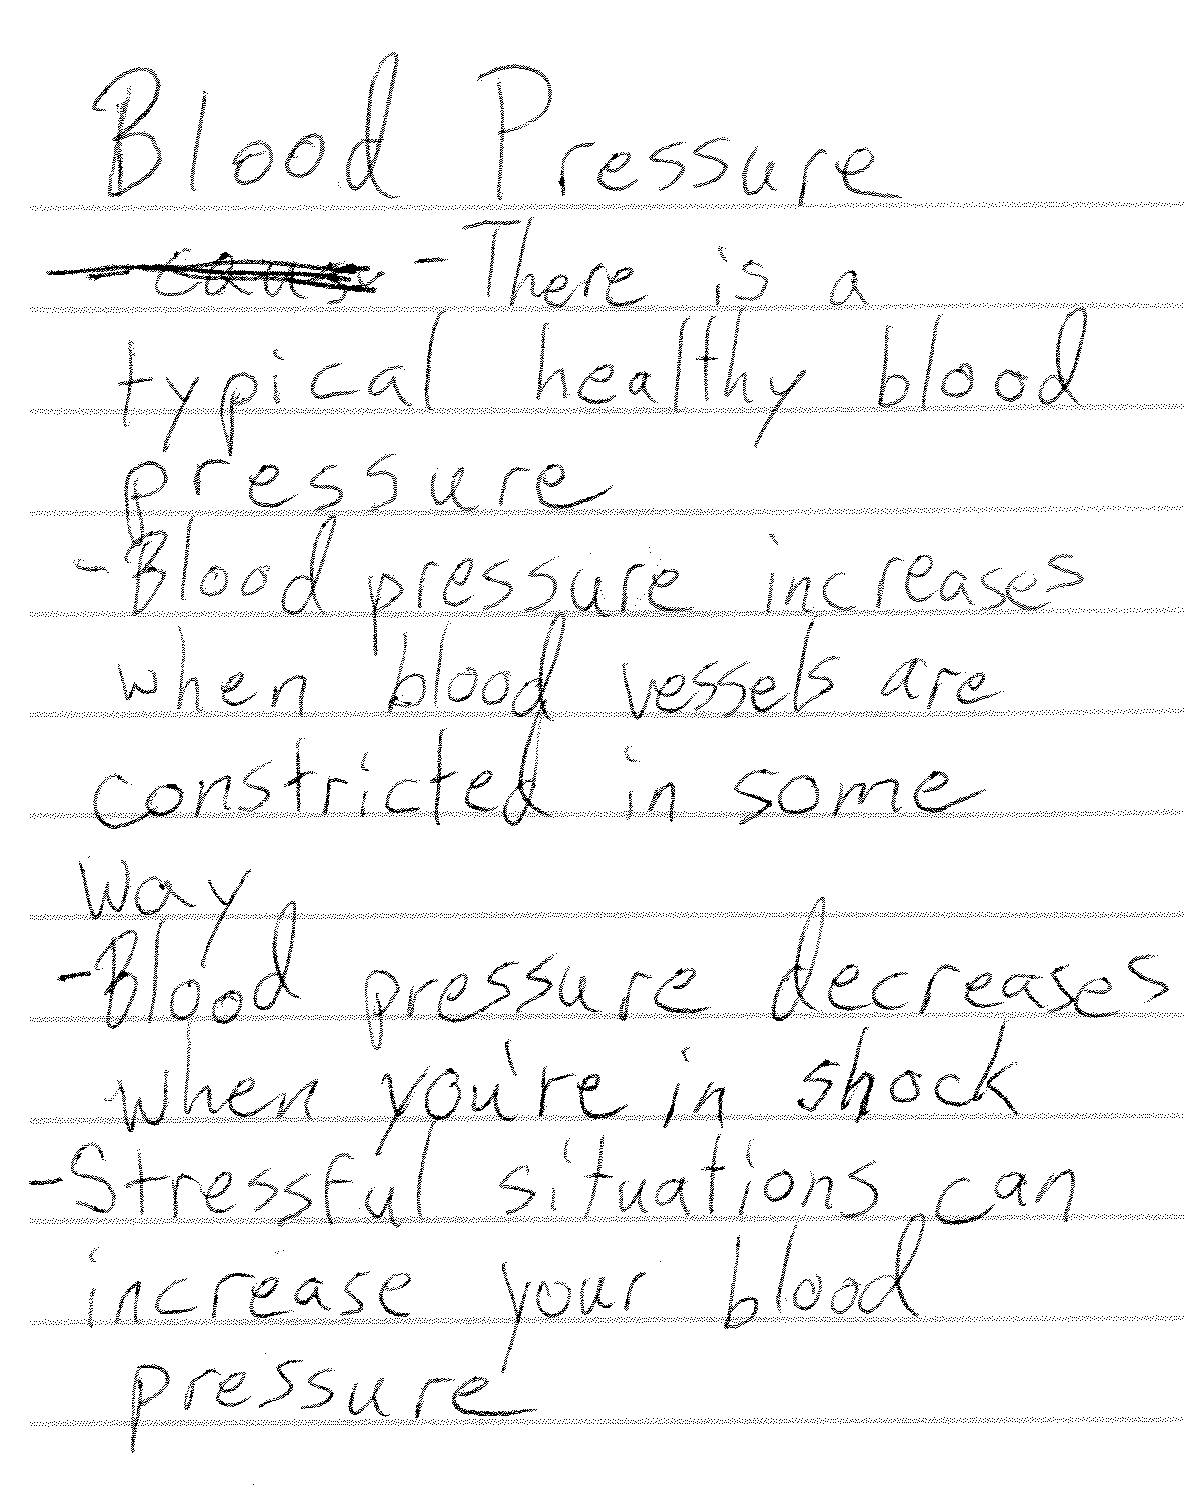

Then, we discussed our ideas as a group. As you watch the discussion below, consider:
- What everyday and school knowledge do participants draw on to explain blood pressure? Do you think our ways of thinking about pressure were constrained by the particular problem we were working on? Why or why not?
Following this conversation, the group created the Sponge Model (see image below). Student 3 became the main representative for the Sponge Model, though Student 4 and Dr. T also offered modifications to the model. In the model, the sponge represents the heart. The sponge can be compressed or released. When the sponge is pressed more quickly, that is like the heart beating faster. When the sponge is pressed more forcefully, that is like the blood pressure increasing. The sponge absorbs or expels liquid as it is pressed and released, distally analogous to blood moving in and out of the heart. The model includes a "dying away" component (diSessa, 1993; Hammer, 1996) to possibly explain why a blood pressure reading contains two different measurements, one called diastolic and the other systolic.

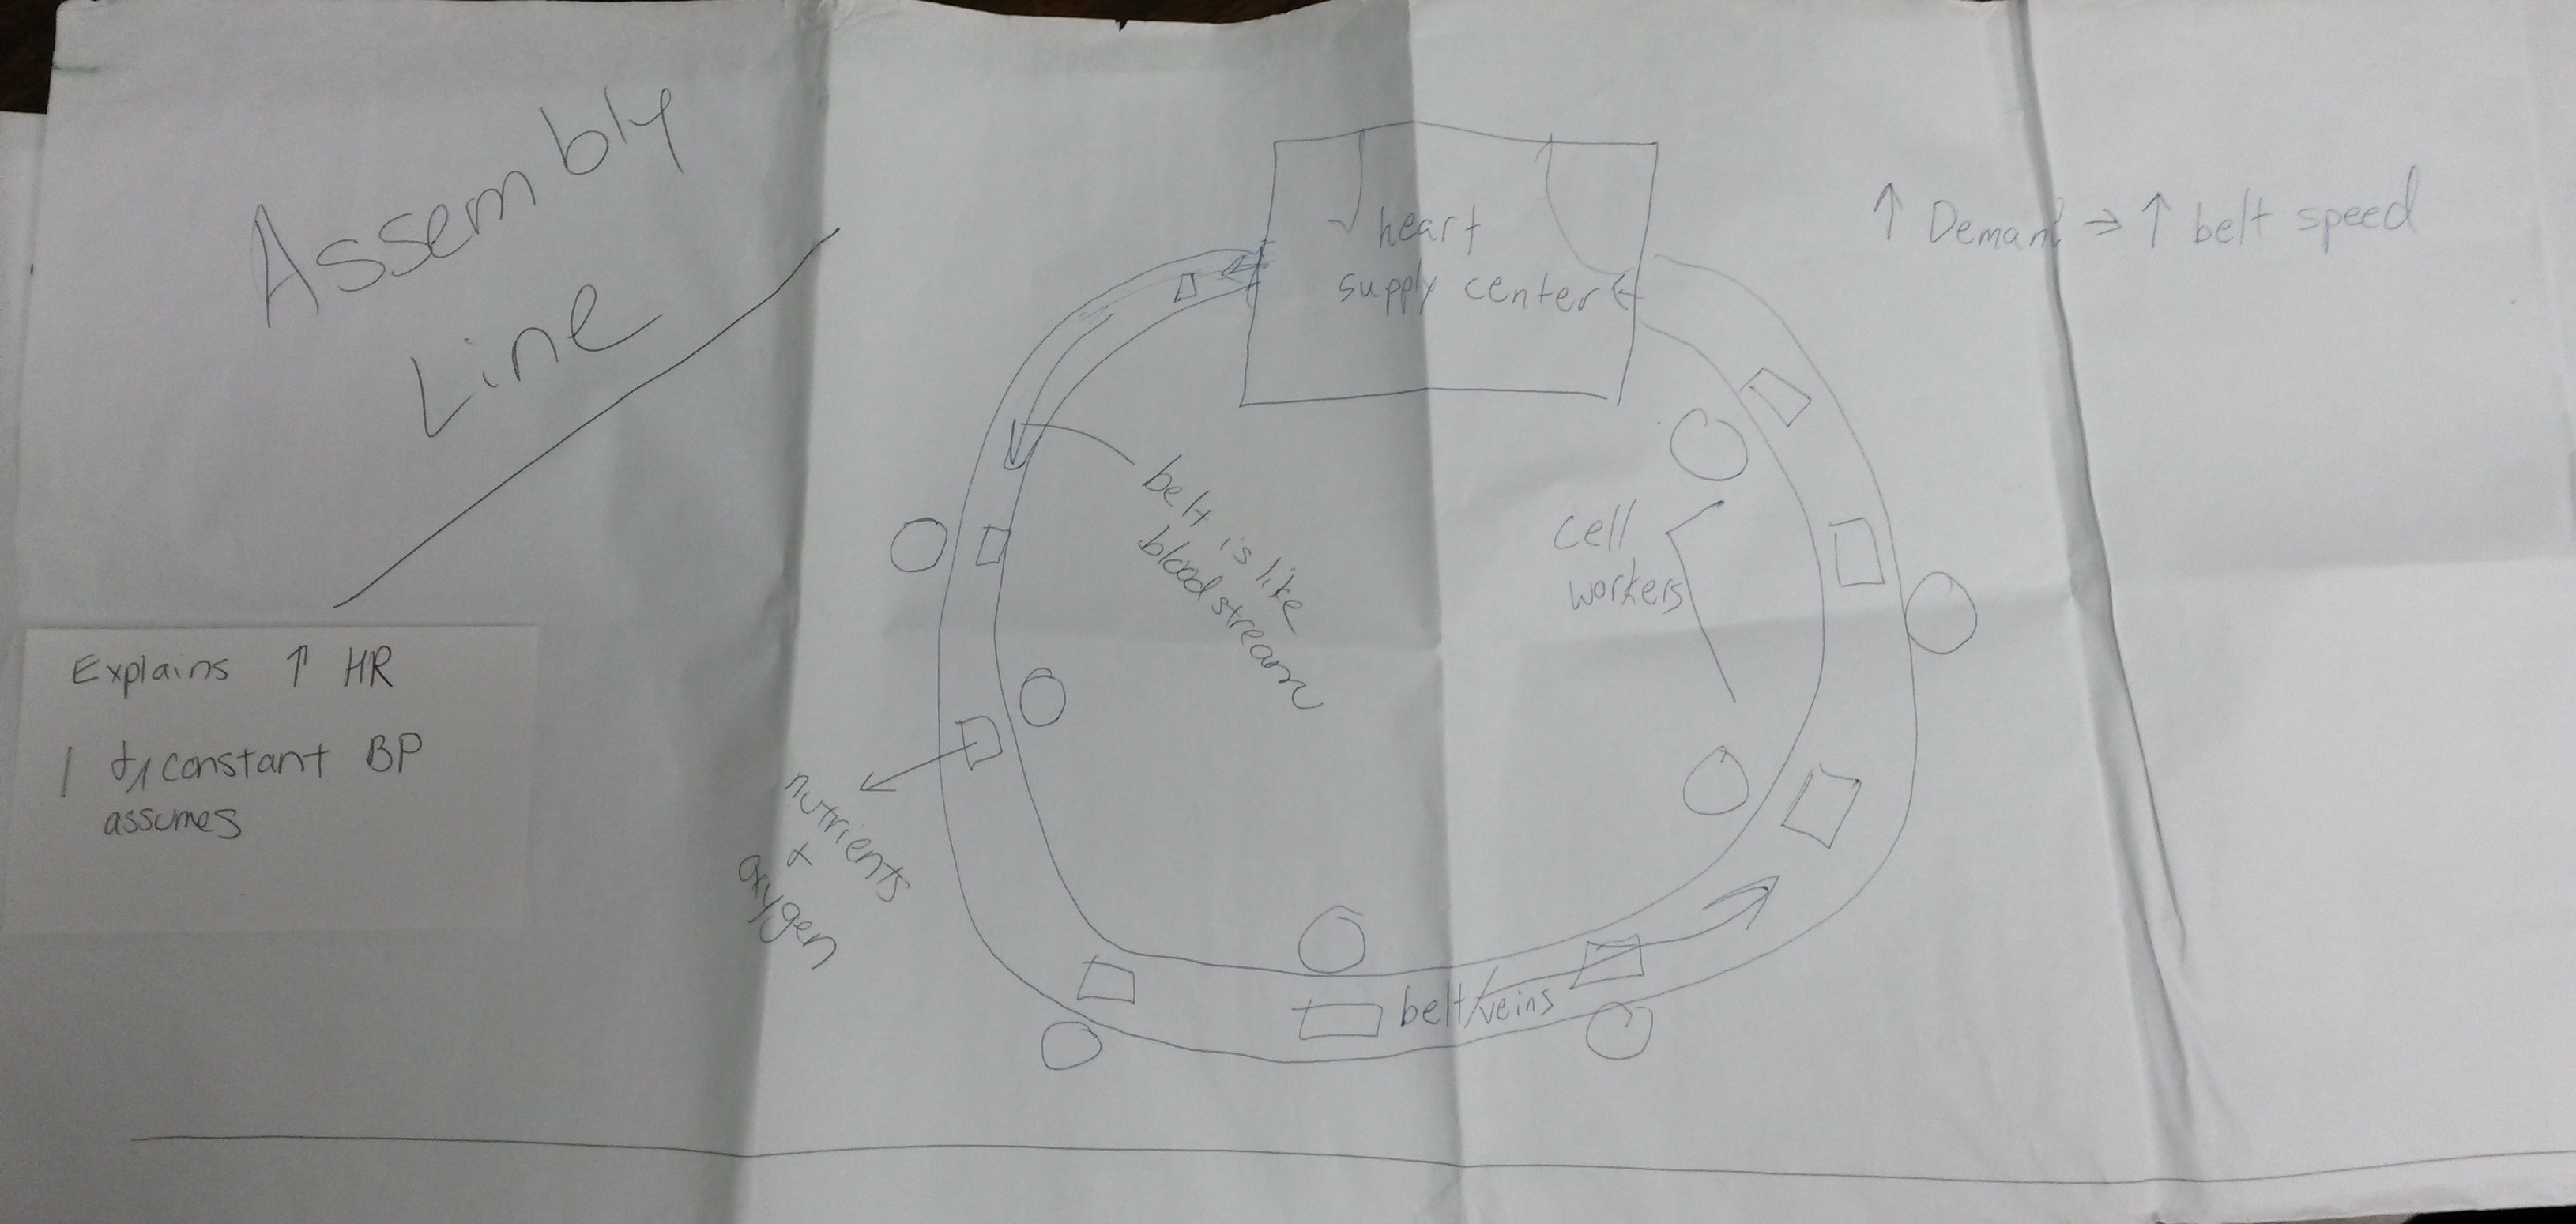
The Sponge Model contained a few weaknesses: it could not be used to make predictions and it did not explain what caused the heart rate or blood pressure to change. Thus, the group continued to create and refine competing models, including the Student 5's Soccer Ball Model first introduced on Day 1, Student 4's Assembly Line model introduced on Day 5, and Student 2's Car Model also introduced on Day 5. All of the models shared in common the idea of increased demand causing an increase in movement or supply.

The Need for Experimentation Arises
Student 2 suggested building into the Car Model an option for the pipes to dilate or contract in order to maintain constant blood pressure. Dr. T expresses concern over lack of evidence for constant blood pressure, which leads to Student 5 requesting opportunity for experimentation:
We conducted the experiment that Student 5 described twice, but instead of running, we tried climbing three flights of stairs. We compiled our data into a chart, and tried to look for patterns in heart rate and blood pressure changes. We saw some increases in heart rates and blood pressure, but with so few measurements, and also our difficulty taking quick measurements with the sphygmomanometers, we were unwilling to draw any strong conclusions from the data. We also examined published data (Table 2 of Miyai et al., 2002; Stohr, Gonzales-Alonso, & Shave, 2011) to see if we could refine or eliminate any of the four models (Assembly Line, Soccer Ball, Sponge, and Car Model). While all of the models could be used to interpret the patterns in the data, none of the models could actually predict the patterns.
Revisiting The Soccer Ball Model
At almost every session, Student 3 expressed concern that our collection of models could explain either address heart rate or blood pressure, but none of the models could account for movement's effect on both heart rate and blood pressure. Student 1 believed that the Soccer Ball model might be able to account for both, and explained how:
However, the Soccer Ball Model assumes that the speed of the blood moving through the arteries and veins slows. Student 3 and Student 4 challenge the "dying away" story, arguing that no external force acts on the blood to slow it down.
Realizing that none of the existing models are satisfactory, the group decides to generate an entirely new set of models: the Clock Model, the Ferris Wheel Model, the Epidemic Model, and the Pump Model. Rather than move toward consensus, we faced a proliferation of models.
Consensus Without an Answer
The new set of models were discussed on the final day (Day 6) of doing science. We ran out of time before reaching an evidence-based, consensus model to the opening question, How does movement affect heart rate and blood pressure, and what's your logic? So, as a form of closure, we held a final reflection conversation addressing two questions:
- What can we all agree on?
- What features would we want our consensus model to have?
As shown in the transcript below, we decide that a consensus model would need to explain the nature of the relationship between heart rate, blood pressure, and movement. Student 2 would like the final model to explain the two different values of blood pressure (systolic and diastolic), but others are not sure that belongs in this model. A few students suggest that we might have made more progress had we tried to build one model focusing on just heart rate or blood pressure, rather than trying to address both simultaneously.
|
Transcript: What features should our consensus model have?
|
Future Considerations
In this project, we were eager to understand how bringing science and science education faculty together to co-facilitate doing science would shape the inquiry. The predominant model of science and education faculty collaboration is bridging expertise, whereby education faculty are presumed to provide teachers knowledge of pedagogy and practical classroom experience, and science faculty the content expertise. However, Dr. H and Dr. T took on roles that seemed to blur the boundaries between "content" or "pedagogy" expert (Sikorski & Doebel, 2015). For example, Dr. T tended to clarify students' ideas ("So you're saying...") and prompt reflection on the fruitfulness of ideas ("What are we trying to answer?). Dr. H tended to evaluate ideas based on authenticity ("Is this an honest model?") and precision ("What does 'stuff' mean?). Dr. T encouraged students to reflect on their ideas ("What models do we have on the table?") and Dr. H encouraged students to reflect on their experiences ("How are you feeling right now?"). Both Dr. H and Dr. T checked ideas for reasonableness ("Why does the pressure go up?), and alignment with their science knowledge. We anticipate that closer attention to the facilitation moves of each instructor will inform future collaboration between science and science education faculty.
Differences in the facilitators' and teacher candidates' perceptions of our doing science warrant further attention:Dr. H and Dr. T reported that the opening question grew out of
- the teacher candidates' discussion of a lesson on the circulatory system, but during the final doing science discussion, the teacher candidates asked where the opening question came from, revealing that they did not share the same sense of origin for the question as the instructors.
- Also in the final discussion, multiple students expressed a desire to simplify the opening question to make it easier to answer. Dr. H and Dr. T thought that simplifying the question would undermine students' opportunities for doing, and specifically their having to determine how to bound the phenomenon of interest.
- During one of the days that we did not work on the heart rate/blood pressure problem, the teacher candidates read and discussed Feynman's article Science is Not Words. To the surprise of Dr. T, the teacher candidates tagged their discussion of Feynman's article as exemplary evidence of their doing science.
Teacher candidates' journals and course evaluations reveal that doing science was a memorable and meaningful part of their teacher preparation program (see Sikorski, accepted). However, much remains to be understood about what and how teacher candidates learn about facilitating inquiry and science practices through these experiences, and the critical design elements and in-the-moment decisions that make for productive doing science experiences.
Recommended Citation
Sikorski, T. & Doebel, H. (2016). Doing Science Case Study [blog post]. Retrieved from https://blogs.gwu.edu/teachstem/doing-science/
Related Project Publications
Sikorski, T., & Doebel, H. (2015). A disciplinary practices-oriented rationale for science and science education faculty collaboration in pre-service methods courses. Paper presented at the Annual Meeting of the National Association for Research in Science Teaching, Chicago, IL.
References
Duckworth, E. R. (Ed.). (2001). " Tell me more": Listening to learners explain. New York: Teachers College Press.
Harvey, W. (1989). Anatomical exercises on the generation of animals. The Works of William Harvey.
Hammer, D. (1996). Misconceptions or p-prims: How may alternative perspectives of cognitive structure influence instructional perceptions and intentions. The Journal of the Learning Sciences, 5(2), 97-127.
Megill, M. (2000). Heart failure. Dartmouth Medicine, 34-37.
Russ, R. S., Scherr, R. E., Hammer, D., & Mikeska, J. (2008). Recognizing mechanistic reasoning in student scientific inquiry: A framework for discourse analysis developed from philosophy of science. Science Education, 92(3), 499-525.
Stöhr, E. J., González-Alonso, J., & Shave, R. (2011). Left ventricular mechanical limitations to stroke volume in healthy humans during incremental exercise. American Journal of Physiology-Heart and Circulatory Physiology, 301(2), H478-H487.
van Zee, E. H., Hammer, D., Bell, M., Roy, P., & Peter, J. (2005). Learning and teaching science as inquiry: A case study of elementary school teachers' investigations of light. Science Education, 89(6), 1007-1042.
Wiggins, G. P. (1998). Educative assessment: Designing assessments to inform and improve student performance (Vol. 1). San Francisco, CA: Jossey-Bass.